XEQT vs VFV: Global Diversification or All-In on the S&P 500?
One fund holds 8,400 stocks across 50 countries at 0.20% MER. The other holds 500 American companies at 0.09%. The real question isn't which performed better — it's which risk you're actually being compensated for.
Disclosure: This article contains referral links. Compensation may be received at no cost to you — this does not influence our analysis or recommendations.
TL;DR: For most long-term Canadian investors, XEQT is the safer default. VFV costs less (0.09% vs 0.20% MER) and has outperformed recently, but concentrates 100% in 500 U.S. stocks — the top 10 alone control 40.7% of the index. You’re essentially betting that U.S. market dominance is permanent.
- Holding both XEQT and VFV doesn’t diversify — VFV’s S&P 500 already makes up ~45% of XEQT, so a 50/50 split gives you 72.5% U.S. exposure
- VFV makes sense in an RRSP above $50K via VOO (eliminates FWT)
- The S&P 500 already delivered a lost decade from 2000-2009
VFV outperformed XEQT by 10.57 percentage points in 2024 — 35.24% vs 24.67% — and the S&P 500 has dominated global equities for most of the past 15 years. But in 2025, the trend reversed: XEQT returned 20.45% while VFV delivered 12.23%, a swing of over 18 points in a single year. If you’re already sold on index investing and want to understand the cultural movement behind it, see our “Just Buy XEQT” guide.
How Do XEQT and VFV Compare Side by Side?
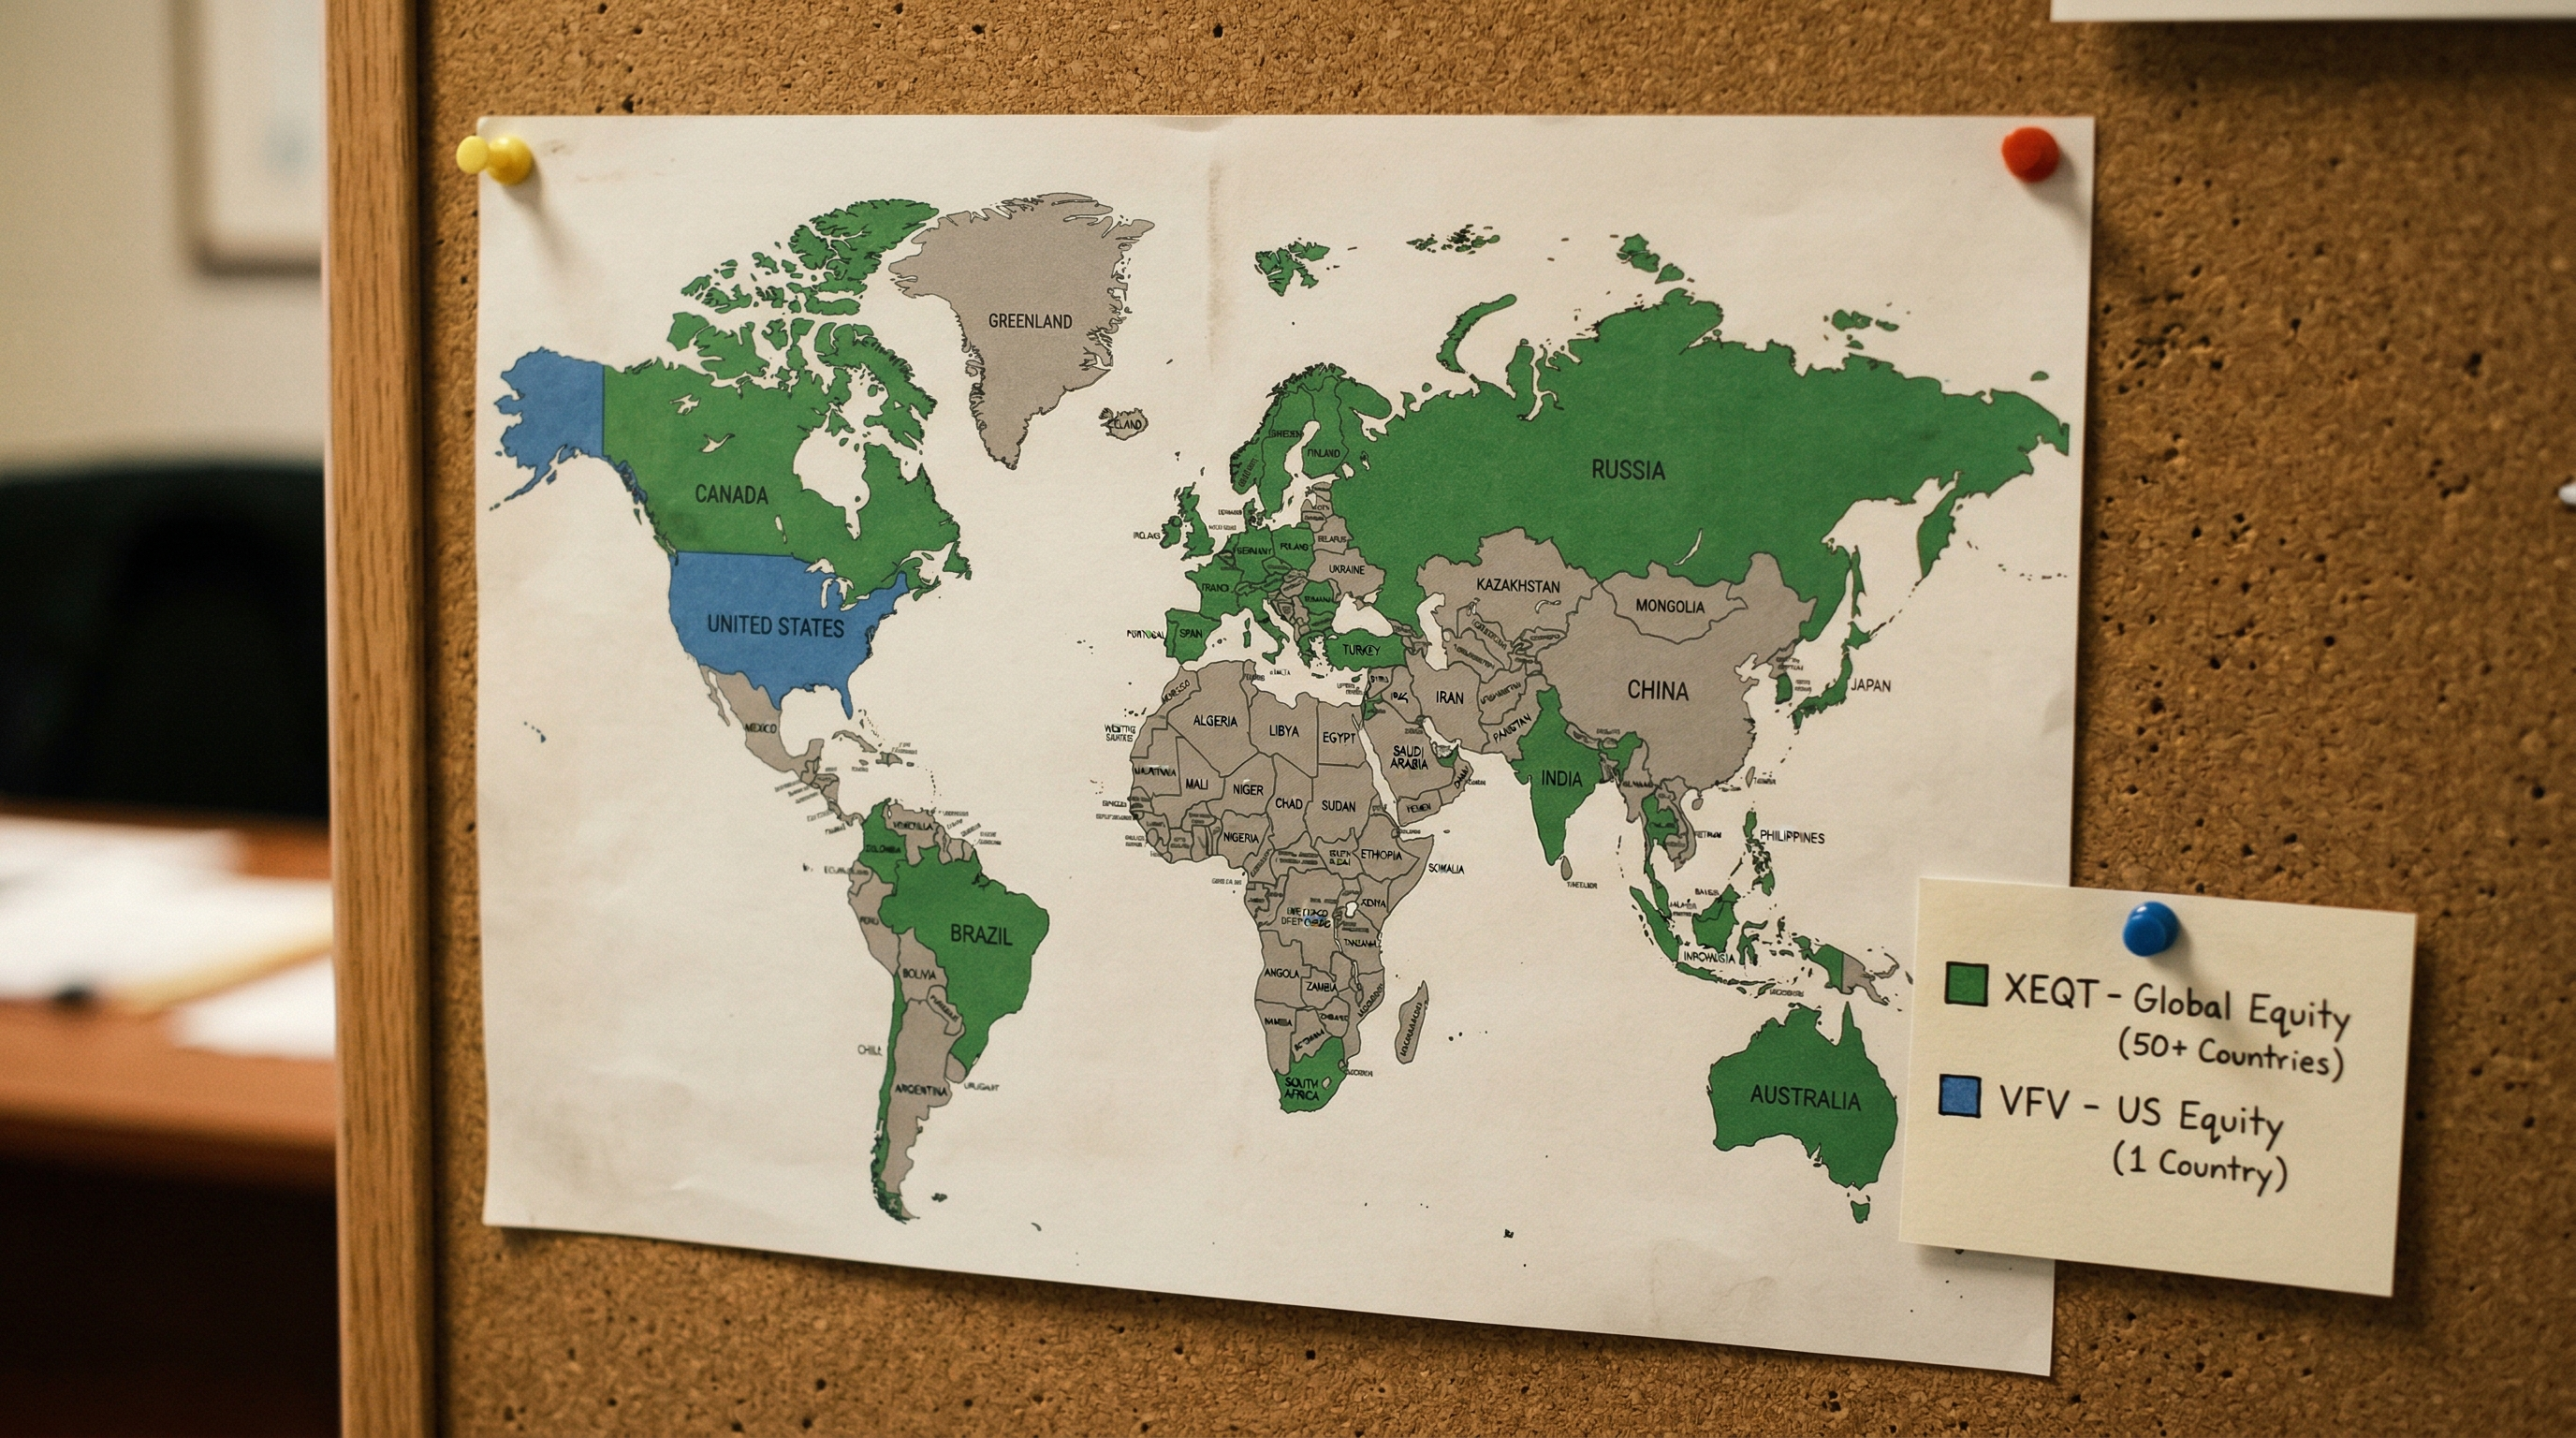
XEQT (BlackRock) is a globally diversified all-equity fund holding approximately 8,400 stocks across 50+ countries at a 0.20% MER, while VFV (Vanguard) is a concentrated S&P 500 ETF holding 500 U.S. large-cap companies at 0.09% MER. They are fundamentally different products designed for different investment philosophies.
| Feature | XEQT (BlackRock) | VFV (Vanguard) |
|---|---|---|
| Index | Multi-index (4 underlying ETFs) | S&P 500 |
| MER | 0.20% | 0.09% |
| Management fee | 0.17% (reduced Dec 2025) | 0.08% |
| Inception | August 7, 2019 | November 2, 2012 |
| Holdings | ~8,400 stocks | ~500 stocks |
| AUM | ~$14.8 billion | ~$28.3 billion |
| Geographic exposure | ~45% U.S., 25% CA, 25% Intl, 5% EM | 100% U.S. |
| Distribution | Quarterly | Quarterly |
| Currency hedging | None | None |
| Currency exposure | USD, CAD, EUR, JPY, GBP, etc. | 100% USD |
| Trailing 12-mo yield | ~2.0% | ~0.92% |
| Annualized since inception | ~13.95% | 16.99% |
VFV’s $28.3 billion AUM makes it one of the largest ETFs on the TSX — larger than XEQT by nearly double.12 VFV is structurally a “fund of funds”: it holds units of the U.S.-listed Vanguard VOO ETF inside a Canadian wrapper rather than purchasing individual stocks directly. This has no impact on returns but matters for understanding the foreign withholding tax mechanics covered below.
Both XEQT and VFV trade commission-free on Wealthsimple. If you decide XEQT’s global diversification fits your approach, fractional shares let you start with as little as $1.
How Have XEQT and VFV Performed Year by Year?
VFV outperformed XEQT in four of six full calendar years since XEQT’s 2019 launch — but the gap has been narrowing, and 2025 marked the first year XEQT won decisively. All returns are measured in Canadian dollars, reflecting both equity performance and currency movements.12
| Year | VFV Return (CAD) | XEQT Return (CAD) | Delta (VFV − XEQT) | What Drove It |
|---|---|---|---|---|
| 2020 | 15.58% | 11.71% | +3.87% | U.S. tech recovery from COVID |
| 2021 | 27.64% | 19.57% | +8.07% | Peak U.S. mega-cap momentum |
| 2022 | -12.69% | -10.93% | -1.76% | Rate hikes hit U.S. growth stocks harder |
| 2023 | 23.25% | 17.05% | +6.20% | AI boom (Nvidia, Microsoft) |
| 2024 | 35.24% | 24.67% | +10.57% | Magnificent Seven surge |
| 2025 | 12.23% | 20.45% | -8.22% | U.S. tariff shock, international rotation |
VFV wins when U.S. mega-cap tech surges — and loses when concentration backfires. The 2025 reversal was driven by tariff-induced uncertainty hitting U.S. equities while international and Canadian markets rallied, a scenario that global diversification is specifically designed to capture.
For a deeper analysis of XEQT’s performance through each crisis, including the COVID drawdown and 2022 rate shock, see our XEQT ETF Review.
What Happens When You Hold Both XEQT and VFV?
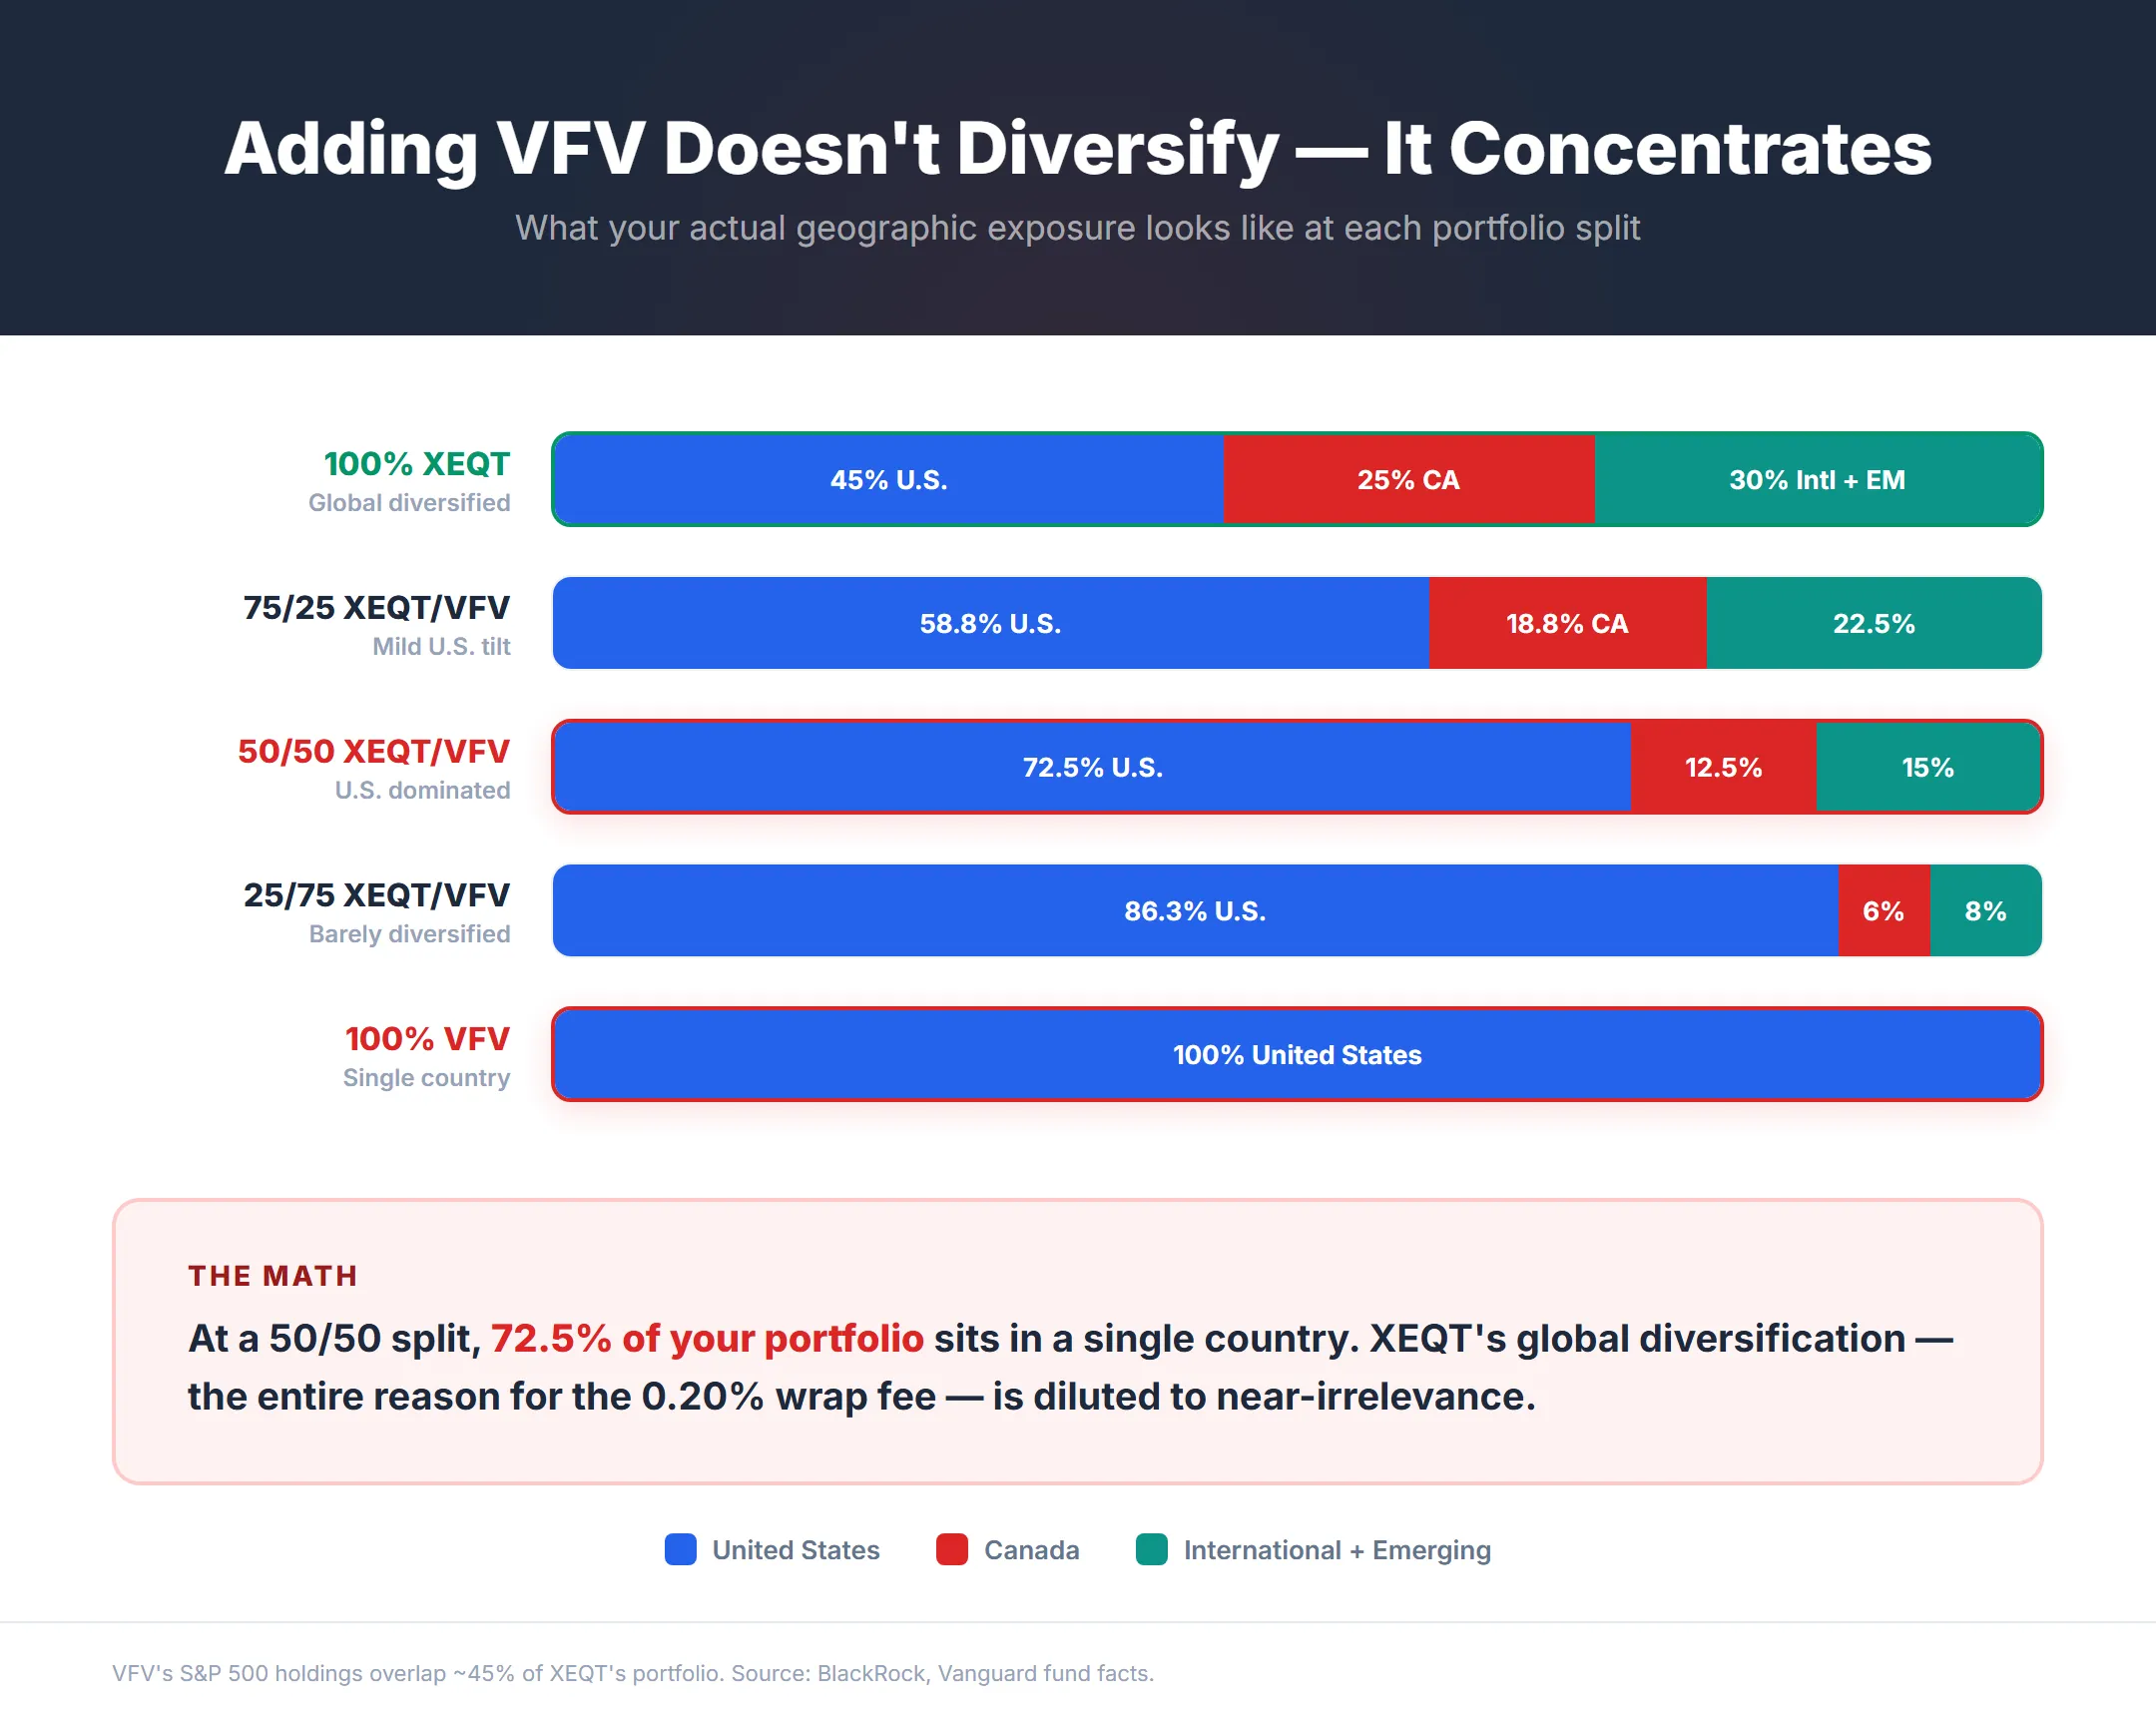
A 50/50 XEQT/VFV split results in 72.5% U.S. exposure — nearly three-quarters of your portfolio in a single country. Because VFV’s S&P 500 holdings already constitute approximately 45% of XEQT’s portfolio (via its underlying iShares ITOT/XTOT U.S. total market ETF), adding VFV on top doesn’t diversify — it concentrates.2
The geographic output of common portfolio splits:
| Portfolio | U.S. Exposure | Canadian | International + EM |
|---|---|---|---|
| 100% XEQT | 45.0% | 25.0% | 30.0% |
| 75% XEQT / 25% VFV | 58.8% | 18.8% | 22.5% |
| 50% XEQT / 50% VFV | 72.5% | 12.5% | 15.0% |
| 25% XEQT / 75% VFV | 86.3% | 6.3% | 7.5% |
| 100% VFV | 100.0% | 0.0% | 0.0% |
At a 50/50 split, Canadian and international diversification — the core structural advantage of XEQT — is diluted to near-irrelevance. The combination is also cost-inefficient: you pay XEQT’s 0.20% “bundling premium” for its all-in-one structure while simultaneously breaking its intended allocation. If your goal is genuinely 70% U.S. exposure, manually combining non-overlapping ETFs (like XIC, XUU, and XEF) achieves that exact split at a weighted MER under 0.10% — cheaper than either fund alone.
To my mind adding another equity ETF to one of the asset allocation ETFs would be akin to buying a top quality cake mix and randomly adding one of the ingredients. And if you choose the extra ingredient based on recent short term returns, you should consider that chasing yesterday’s winners is a ‘buy high, sell low’ strategy.3
— Dan Bortolotti, Portfolio Manager at PWL Capital and creator of the Canadian Couch Potato blog
If you’re considering a VFV tilt because of recent U.S. outperformance, XEQT’s four underlying ETFs are weighted to balance geographic diversification, currency exposure, and home-country bias. Adding VFV overrides those allocations based on recency bias.
Why Does VFV’s S&P 500 Concentration Risk Matter in 2026?
The S&P 500’s top 10 stocks now control 40.7% of the index’s total market capitalization — the highest concentration since the early 1970s, and significantly more extreme than the dot-com peak.4 Between 1990 and 2015, the top 10 weighting hovered in a stable range of 18-23%. At the sector level, Information Technology alone accounts for 32.4% of the index, followed by Financials at 12.5% and Communication Services at 10.5%. The Magnificent Seven — Apple, Microsoft, Alphabet, Amazon, Nvidia, Meta, and Tesla — alone comprise 33.3% of the index.5 Buying VFV is effectively a concentrated bet that these seven companies will continue to dominate.
The concentration creates a structural fragility. In 2025, the top 10 stocks made up 41% of the S&P 500’s weight but generated only approximately 32% of its actual earnings.4 This valuation-to-earnings gap means every dollar invested in VFV automatically sends roughly 40 cents into just 10 companies — inflating their valuations beyond what earnings support.
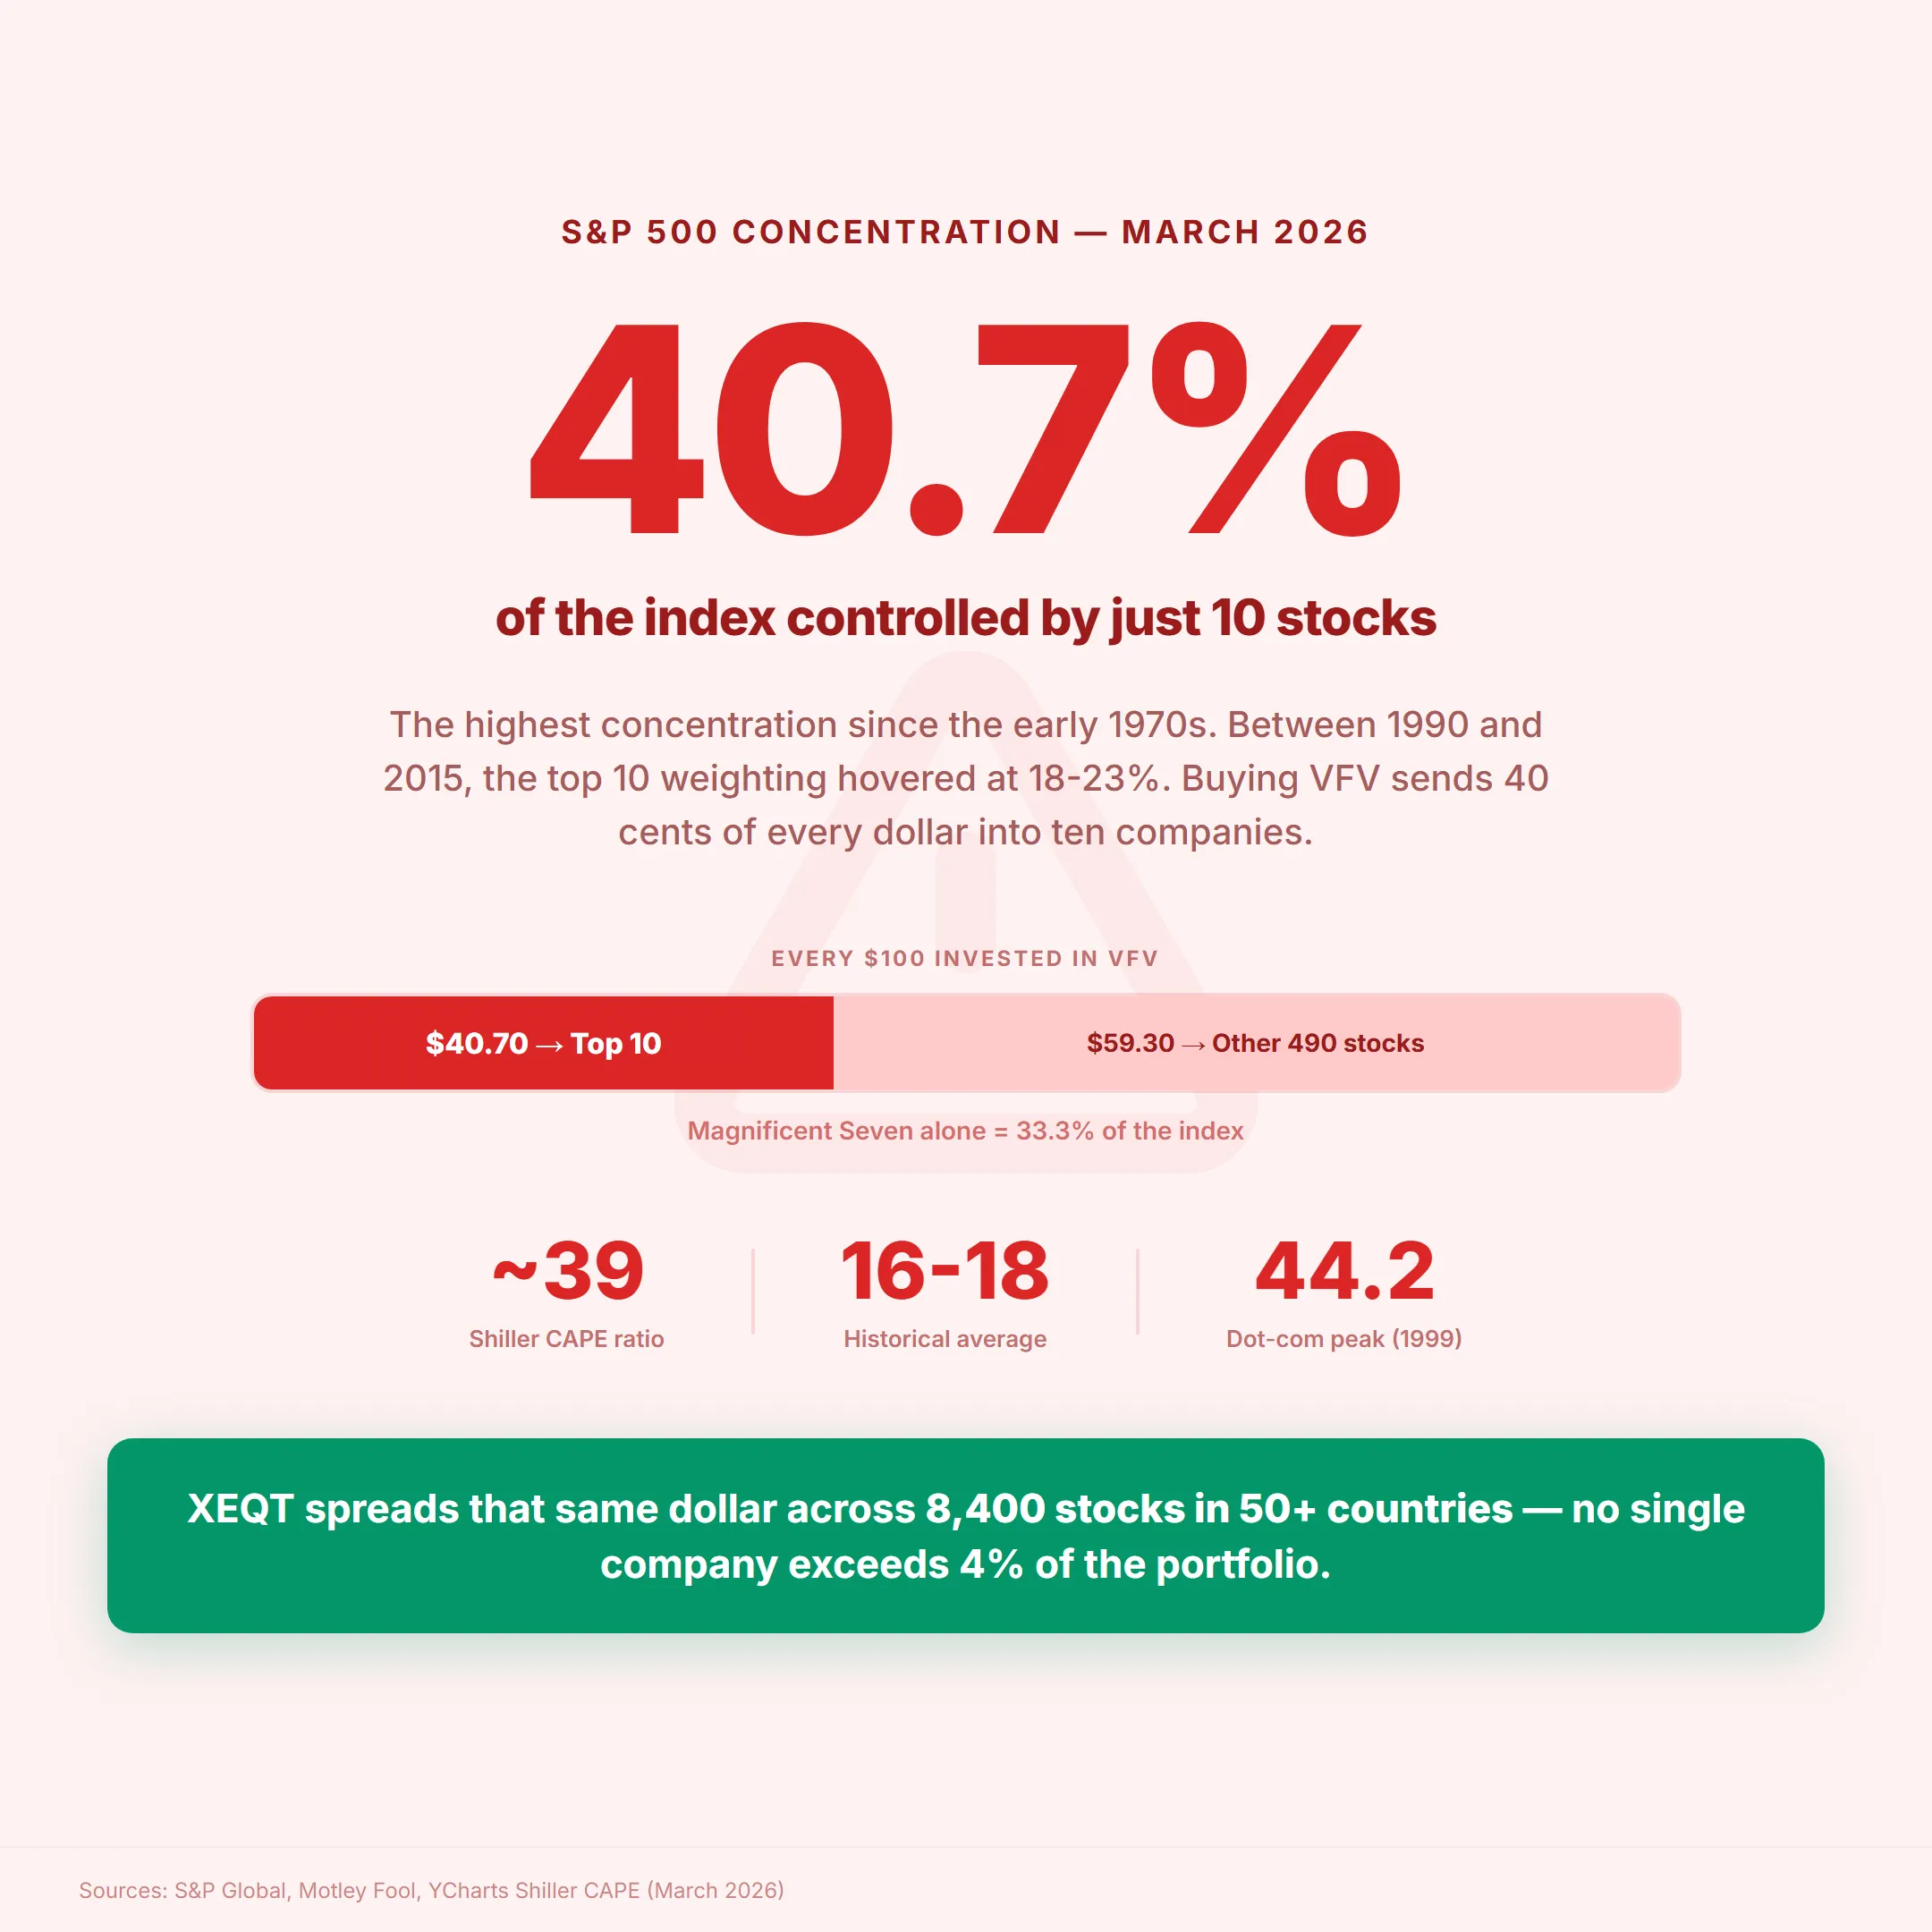
The Shiller CAPE ratio — Nobel laureate Robert Shiller’s cyclically adjusted price-to-earnings measure — sits between 38.93 and 39.51 as of March 2026.6 The historical average is 16-18. The only other time this ratio exceeded current levels in 150 years of data was the absolute peak of the dot-com bubble in December 1999, when it reached 44.20. Institutional models using this metric forecast S&P 500 ten-year forward annualized real returns of just 1.4% to 4.3%.7
The 2000-2009 Precedent
During the dot-com era, market concentration peaked at just under 30% — significantly lower than today’s 40.7%. When that bubble burst, the S&P 500 delivered an annualized return of -3.18% in Canadian dollar terms from 2000 to 2009 — an entire lost decade for U.S.-only investors.8 During that same period, emerging markets surged (the MSCI Emerging Markets Index rose 72.9% in 2009 alone) and Canadian equities posted strong gains. A globally diversified investor was rewarded precisely when the concentrated investor was punished.
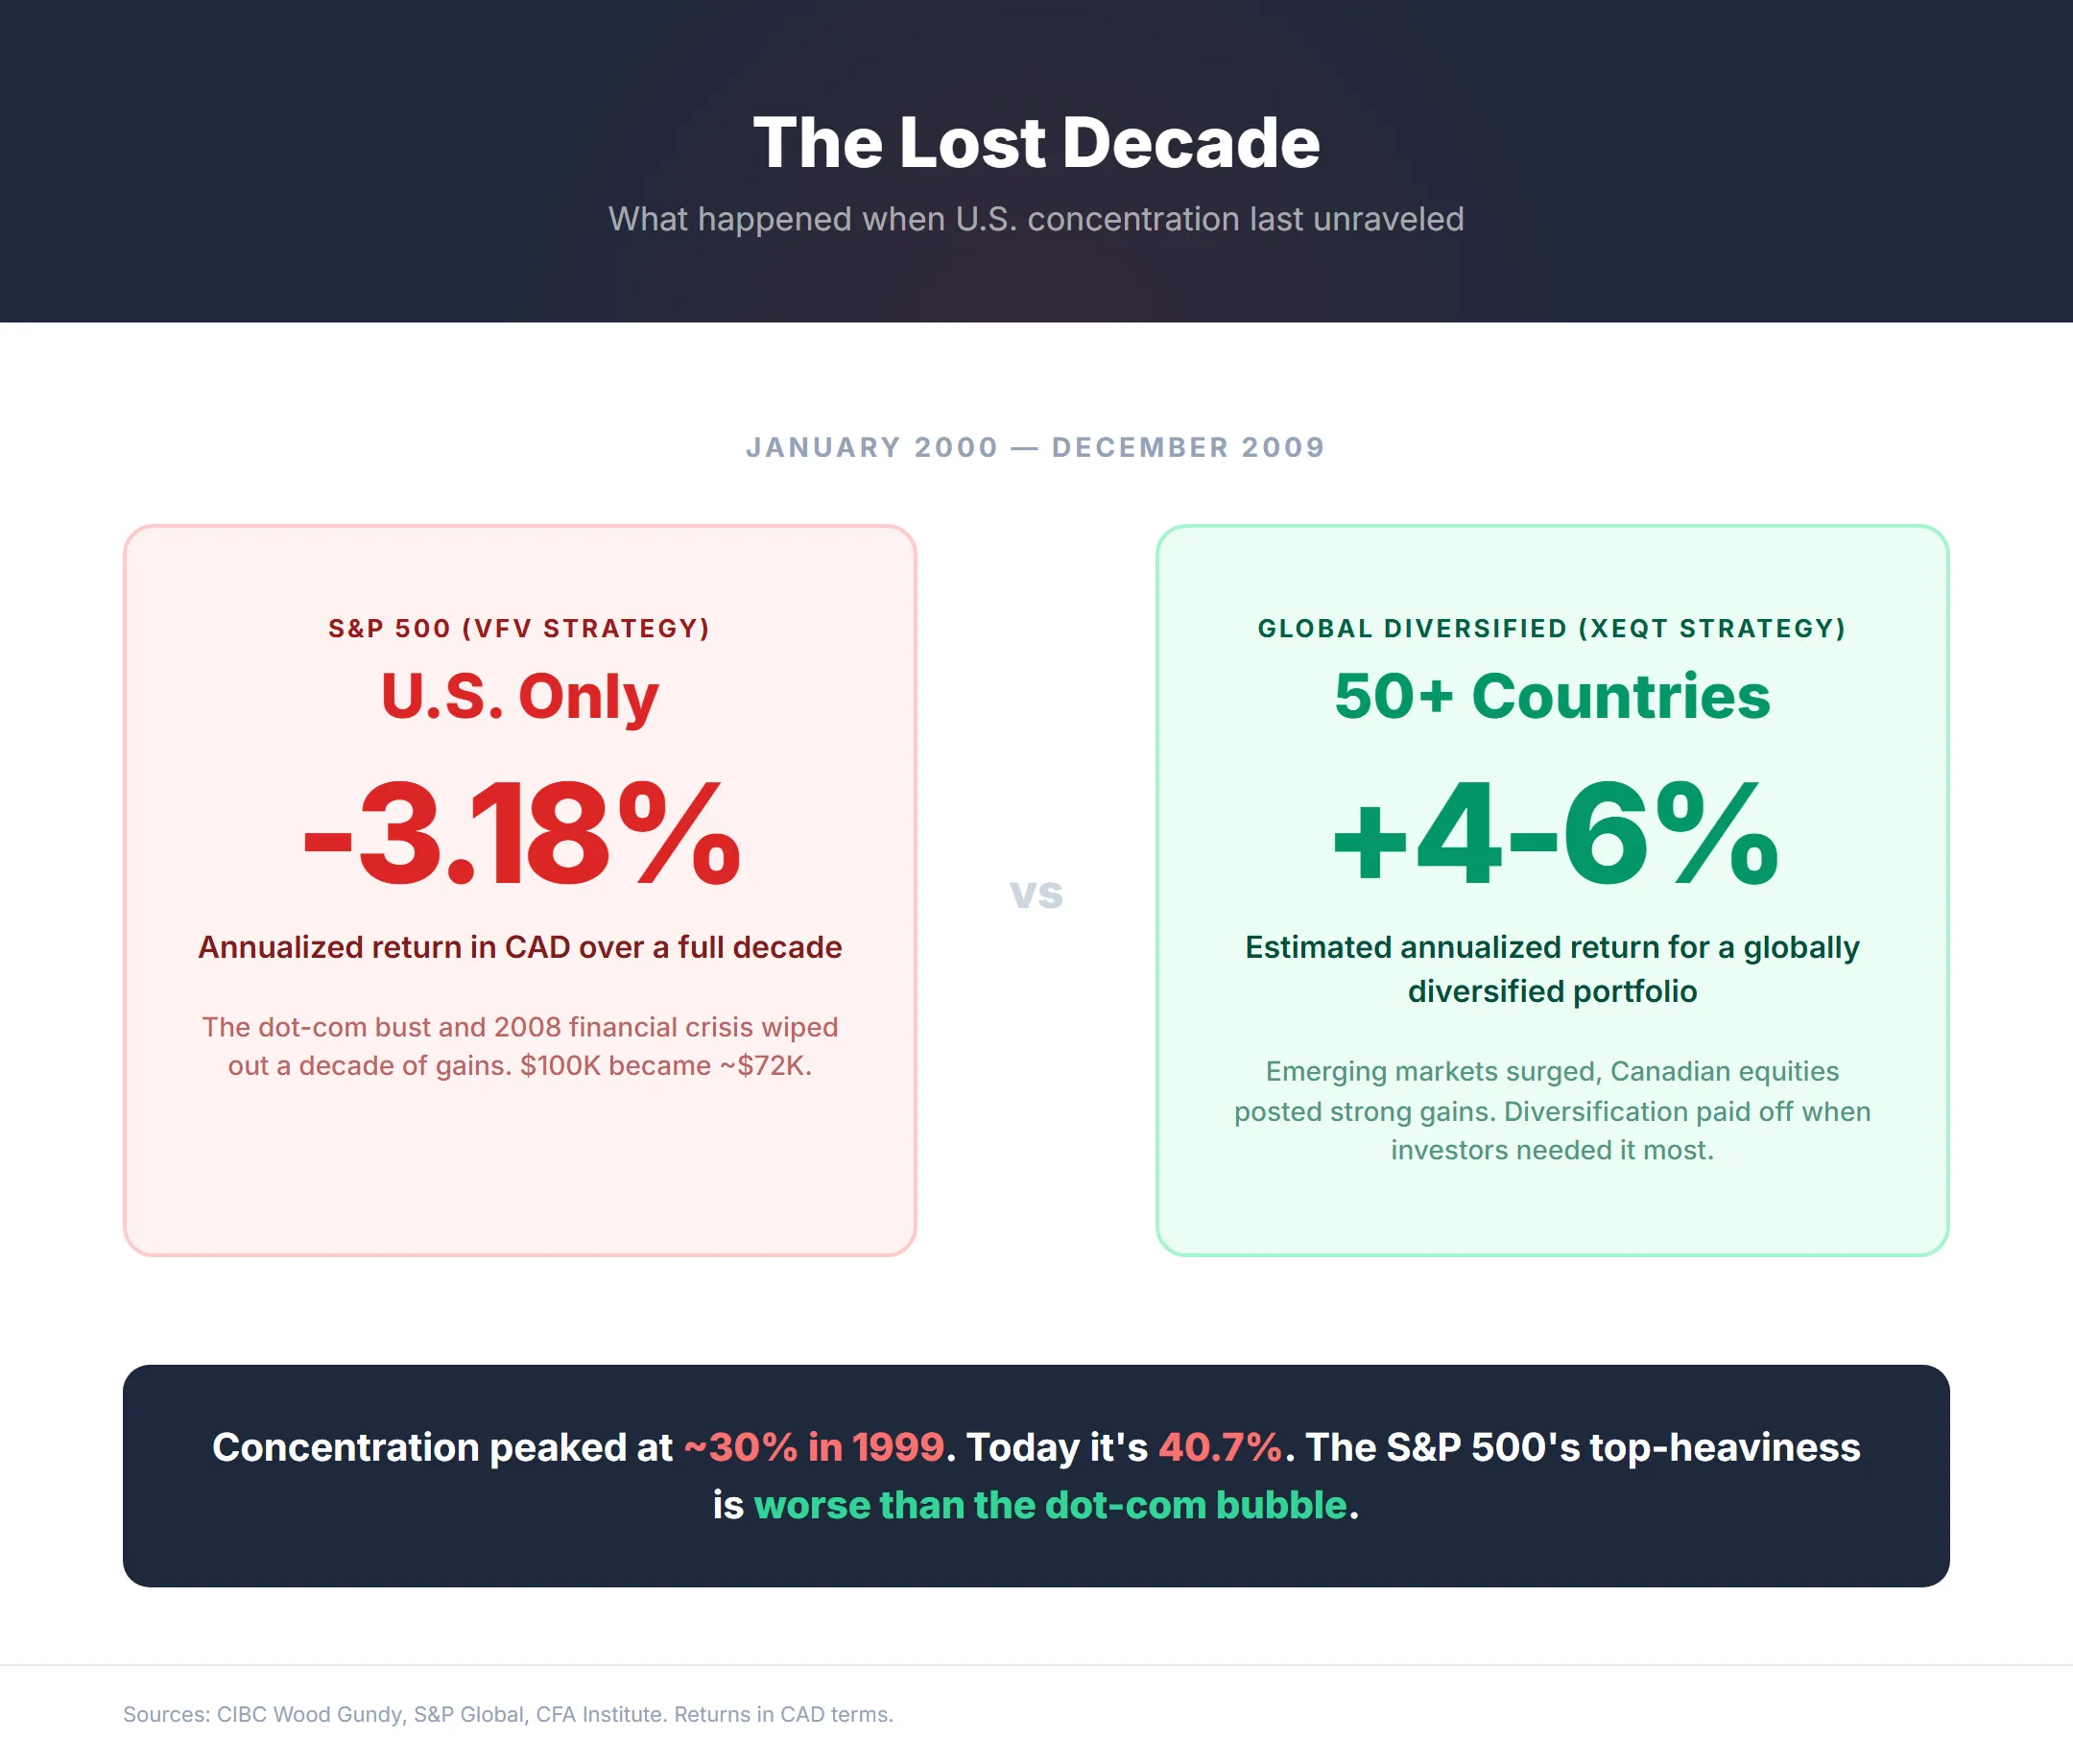
This is the academic concept of “uncompensated risk.” Taking additional concentration risk — betting on a single country or sector — should theoretically come with higher expected returns. But there is no economic law guaranteeing U.S. equities will perpetually outperform, making VFV’s concentration risk uncompensated — more risk without a guaranteed reward.
Ben Felix, Portfolio Manager and Head of Research at PWL Capital, addresses the common claim that S&P 500 companies provide global diversification through their international revenues. Felix calls this reasoning “flimsy, at best,” stating unequivocally that “international diversification is crucial, both theoretically and empirically, to sensible portfolio construction.”9
The Currency Concentration Trap
VFV’s 100% USD exposure means Canadian investors are making two bets simultaneously: that U.S. stocks will rise, and that the U.S. dollar will remain strong against the Canadian dollar. If commodity prices surge — oil, natural gas, metals — the Canadian dollar typically strengthens with them. In that scenario, VFV can lose value in CAD terms even if the S&P 500 stays flat, because currency conversion erodes the returns before they reach your Canadian brokerage account. XEQT structurally mitigates this risk: its 25% Canadian allocation carries zero currency exposure, while the remaining 75% is spread across USD, EUR, JPY, GBP, and other currencies. No single currency movement can dominate the portfolio the way a CAD/USD swing can wipe out VFV’s gains.
How Do XEQT and VFV Differ in a TFSA, RRSP, and Non-Registered Account?
Both VFV and XEQT lose money to the 15% U.S. foreign withholding tax on dividends — but the account type determines whether that cost is permanent, recoverable, or eliminable.10 Neither fund is universally better across all account types. If you haven’t decided which registered account to prioritize overall, our TFSA vs RRSP vs FHSA decision guide walks through the trade-offs by life stage.
TFSA and FHSA
In a TFSA or Wealthsimple FHSA, both VFV and XEQT lose money to foreign withholding tax (FWT). The U.S. IRS withholds 15% on dividends from American corporations before the cash enters any Canadian ETF wrapper. Because the IRS does not recognize TFSAs and FHSAs as retirement accounts under the U.S.-Canada tax treaty, you permanently lose this 15%.10
This withholding is entirely invisible — you will never see a deduction on your brokerage statement. The dividend simply arrives in your account already reduced, slightly lower than the fund’s published gross yield.
For VFV, with a trailing dividend yield of approximately 0.92%, the FWT drag is roughly 0.14% per year. XEQT faces the same drag on its ~45% U.S. allocation plus additional withholding on international dividends. Neither fund has a meaningful FWT advantage in a TFSA — they both leak. The real cost difference in a Wealthsimple TFSA is VFV’s concentration risk, not its tax treatment.
RRSP: The VOO Strategy
The Wealthsimple RRSP is the one account type where VFV investors can unlock a genuine tax optimization. Under the U.S.-Canada tax treaty, the IRS recognizes the Canadian RRSP as a tax-exempt retirement vehicle — but only for U.S.-listed ETFs held directly. Canadian-listed VFV does not qualify.10
By holding Vanguard’s U.S.-listed VOO (0.03% MER) instead of VFV (0.09% MER) inside an RRSP, an advanced investor eliminates the 15% FWT on U.S. dividends and saves on product fees — approximately 0.20% in combined annual savings. On a $100,000 RRSP position, that’s $200 per year compounding over decades.11
The catch: purchasing VOO requires converting CAD to USD. Standard brokerage conversion fees (1.5-2.0%) obliterate years of FWT savings instantly. You can bypass this via Norbert’s Gambit — a currency conversion technique using interlisted securities that typically ties up your capital for several business days while trades settle, and you will still lose a small amount to bid-ask spreads during the swap. Portfolio managers generally estimate this strategy becomes worthwhile at a minimum RRSP balance of $50,000-$100,000.11
Non-Registered: Tax-Loss Harvesting Trap
In a non-registered account, VFV and its closest domestic equivalent ZSP (BMO, also 0.09% MER, also S&P 500) are considered identical property by the CRA because both track the same underlying index. Selling VFV at a loss and buying ZSP within 30 days triggers the superficial loss rule, denying the capital loss deduction entirely.12
To legally harvest losses from VFV, swap it for an ETF tracking a different but related index — Vanguard’s VUN (CRSP U.S. Total Market Index) is the standard substitute. VUN captures the same large-cap exposure as VFV plus mid- and small-cap stocks, on a different benchmark.
Is VFV’s 0.09% MER Advantage Over XEQT Worth the Concentration Trade-Off?
VFV charges 0.09% MER — less than half of XEQT’s 0.20% — creating a guaranteed annual cost saving of 0.11% or $11 per $10,000 invested. Over 30 years on a $100,000 portfolio growing at 7% annually, that MER gap compounds to approximately $8,700 in additional wealth for the VFV holder.12
That $8,700 is real. But it needs context:
The FWT equalizer. In a TFSA, both funds lose approximately 0.14-0.25% annually to unrecoverable foreign withholding tax. After accounting for FWT, the effective cost gap narrows to roughly 0.07-0.11% depending on dividend yields and geographic allocation. The MER advantage isn’t as large as the published numbers suggest.10
The concentration cost. During the 2000-2009 lost decade, global equity markets delivered positive annualized returns while the S&P 500 returned -3.18% in CAD terms.8 A single decade of underperformance at that magnitude erases centuries of MER savings. The 0.11% cost difference is the premium for global diversification — insurance against the exact scenario that has already happened within living memory.
The $250K context. For most retail investors below $250,000, the MER gap amounts to less than $275 per year — roughly $23 per month. XEQT’s automatic multi-geography rebalancing eliminates the complexity of manually managing multiple ETFs across regions, which would cost more in trading commissions and behavioral mistakes than the MER savings.11
For context, the average Canadian mutual fund charges a MER above 2% — ten times either fund’s fee.13 Both VFV and XEQT represent massive improvements over the status quo.
Should Canadian Investors Buy XEQT or VFV in 2026?
For most Canadian investors with a 10+ year time horizon, XEQT provides a stronger structural foundation — not because the S&P 500 is a bad investment, but because concentrating 100% of your portfolio in a single country carries uncompensated risk that is currently amplified by historically extreme valuations and sector concentration.
VFV genuinely makes more sense in a few specific scenarios:
- RRSP optimization above $50K-$100K. Investors with large RRSP balances who are willing to execute Norbert’s Gambit should consider holding VOO directly (not VFV) to eliminate FWT and reduce MER to 0.03%
- Deliberate U.S. tilt with eyes open. If you understand the concentration risk, have read the lost decade history, and still want U.S.-only exposure as a calculated bet — VFV is the most cost-efficient vehicle. This is a portfolio decision, not a product flaw
- Non-registered accounts. VFV’s 100% U.S. holdings generate no Canadian eligible dividends. If your non-registered allocation already has Canadian equity coverage through other holdings, VFV avoids redundant domestic exposure
For everyone else — beginners, TFSA/FHSA investors, those who don’t want to think about geographic allocation — XEQT provides the stronger default. Both funds are available commission-free on Wealthsimple with fractional shares starting at $1. Use referral code 9C6DMQ to get a $25 cash bonus on your first deposit.
For XEQT vs Vanguard’s all-equity equivalent, see XEQT vs VEQT.
Frequently Asked Questions
Is it redundant to hold both VFV and XEQT?
Yes. VFV’s S&P 500 holdings already constitute approximately 45% of XEQT’s total portfolio. A 50/50 XEQT/VFV split results in 72.5% U.S. exposure, 12.5% Canadian, and 15% international — heavily diluting XEQT’s global diversification into what is effectively a U.S. momentum tilt.2
Should I put 100% of my TFSA in VFV?
You can, but understand the hidden costs. VFV inside a TFSA loses approximately 0.14% annually to unrecoverable U.S. foreign withholding tax on dividends — and XEQT faces similar drag on its U.S. component. Neither fund has a FWT advantage in a TFSA. The real risk with 100% VFV is single-country concentration: zero exposure to Canadian, international, or emerging market equities.10
Does XEQT hold the S&P 500?
Not directly, but effectively yes. XEQT’s largest underlying holding is iShares ITOT/XTOT (U.S. total market), which includes all 500 S&P 500 companies plus mid- and small-cap U.S. stocks. The U.S. allocation represents approximately 45% of XEQT’s total portfolio — so buying XEQT means roughly half your money is in the same companies as VFV, with the rest spread globally.2
Should I buy VFV or VSP?
Both are Vanguard S&P 500 ETFs charging 0.09% MER. VFV is unhedged (returns include USD/CAD currency movements), while Vanguard hedges VSP using derivative forward contracts. For holding periods of 10+ years, VFV is broadly preferred because hedging costs create a persistent performance drag through tracking error. VSP only makes strategic sense if you strongly believe the Canadian dollar will appreciate significantly against the USD in the short-to-medium term.1
What is the difference between VFV and ZSP?
VFV (Vanguard) and ZSP (BMO) both track the S&P 500 at 0.09% MER. The structural difference is replication methodology: VFV operates as a “fund of funds” holding units of the U.S.-listed VOO, while ZSP directly purchases all 500 constituent stocks. Performance variance over a rolling ten-year period is negligible — mere basis points of tracking error. The choice is brand preference.
Is VFV a good long-term investment?
VFV has delivered 16.99% annualized since its November 2012 inception — an exceptional track record driven by the longest U.S. bull market in history.1 The risk is concentration: the S&P 500’s top 10 stocks now control 40.7% of the index, and the Shiller CAPE ratio near 40 historically forecasts compressed forward returns of 1.4-4.3% annualized real over the next decade.67
Can I use VFV and ZSP for tax-loss harvesting?
No. The CRA considers VFV and ZSP identical property because both track the same S&P 500 index. Swapping between them within 30 days triggers the superficial loss rule, denying the capital loss. To legally harvest losses from VFV, swap for an ETF tracking a different index — Vanguard’s VUN (CRSP U.S. Total Market Index) is the standard substitute.12
How does VFV compare to VOO for Canadian investors?
VOO is the U.S.-listed version of the same Vanguard S&P 500 fund at 0.03% MER — less than one-third of VFV’s 0.09%. Inside an RRSP, holding VOO directly also eliminates the 15% U.S. foreign withholding tax on dividends, saving approximately 0.20% annually combined. The catch is currency conversion: Norbert’s Gambit is required to avoid brokerage FX fees, making this practical only for RRSP balances above $50,000-$100,000.11
Is the S&P 500 too concentrated right now?
By historical standards, yes. The top 10 stocks control 40.7% of the S&P 500’s market capitalization — the highest level since the early 1970s. During the dot-com peak, concentration was under 30%. The “Magnificent Seven” alone comprise 33.3% of the index. Information Technology represents 34.7% of the total weight, followed distantly by Financials at 13.3%.45
What happened during the 2000-2009 lost decade for S&P 500 investors?
The S&P 500 returned -3.18% annualized in Canadian dollar terms from January 2000 to December 2009 — a full decade of losses. During the same period, emerging markets and Canadian equities delivered strong positive returns. The 2000-2009 lost decade is the primary evidence that U.S. market dominance is cyclical, not permanent, and that global diversification pays off precisely when investors need it most.8
What is the Canadian equivalent to the S&P 500?
The closest Canadian equivalent is the S&P/TSX 60 Index, which holds the 60 largest companies on the Toronto Stock Exchange. The most popular ETF tracking it is iShares XIU. However, XEQT is not a Canadian equivalent to the S&P 500 — XEQT is a globally diversified fund that includes Canadian, U.S., international, and emerging market equities. If you want pure Canadian large-cap exposure alongside VFV, XIU is the domestic counterpart.
Sources
Footnotes
Vanguard Canada — VFV Vanguard S&P 500 Index ETF ↩ ↩2 ↩3 ↩4 ↩5
BlackRock — iShares Core Equity ETF Portfolio (XEQT) ↩ ↩2 ↩3 ↩4 ↩5 ↩6
Canadian Couch Potato — Dan Bortolotti on mixing asset allocation ETFs ↩
S&P Global — “In the shadows of giants” (S&P 500 concentration analysis) ↩ ↩2 ↩3
The Motley Fool — The Magnificent Seven’s Market Cap vs. the S&P 500 ↩ ↩2
CIBC Wood Gundy — “The Science Behind the Numbers: A Tale of Two Decades” ↩ ↩2 ↩3
Vanguard Canada — The impact of withholding taxes on Canadian ETF investors ↩ ↩2 ↩3 ↩4 ↩5
Canadian Portfolio Manager — Foreign Withholding Tax on ETFs (Justin Bender) ↩ ↩2 ↩3 ↩4
Advisor.ca — Tax loss selling: Using Canadian-listed ETFs to defer taxes on capital gains ↩ ↩2

About the Author
Isabelle Reuben is a specialized finance writer focused on Canadian investment platforms and bonus optimization. With 5+ years tracking robo-advisors, she stress-tests Wealthsimple's features to transform fine print into actionable blueprints.