XEQT vs VEQT: Which All-Equity ETF Should Canadian Investors Buy?
Two all-in-one equity ETFs, one 0.04% MER gap, and a distribution frequency split that matters less than you think — here's what actually differentiates BlackRock's and Vanguard's flagship funds.
Disclosure: This article contains referral links. Compensation may be received at no cost to you — this does not influence our analysis or recommendations.

TL;DR: XEQT and VEQT are functionally the same investment. Both now charge a 0.17% management fee — the remaining MER gap costs $40 per year on $100K, less than a dinner out. Pick either one and you’re ahead of the 98.8% of active funds that underperformed their benchmark over 10 years.
- XEQT: quarterly dividends, 25% Canada, fixed-weight rebalancing
- VEQT: annual dividend, 30% Canada, market-cap float
- 90% overlap in holdings — holding both adds complexity for zero benefit
XEQT and VEQT are the two most popular all-equity ETFs in Canada, and the honest answer is that choosing between them matters far less than choosing to invest at all.1 For the broader case behind all-equity index investing, see our “Just Buy XEQT” guide.
How Do XEQT and VEQT Compare Side by Side?
XEQT and VEQT provide nearly identical global equity exposure through different underlying fund families — BlackRock’s iShares ETFs for XEQT, Vanguard’s index ETFs for VEQT. The table below captures every material difference.
| Feature | XEQT (BlackRock) | VEQT (Vanguard) |
|---|---|---|
| MER | 0.20% | 0.24% (expected ~0.20% after fee cut) |
| Management fee | 0.17% (reduced Dec 2025) | 0.17% (reduced Nov 2025) |
| Inception | August 7, 2019 | January 29, 2019 |
| Holdings | ~8,400 stocks | ~13,000 stocks |
| Canada allocation | ~25% (fixed target) | ~30% (fixed target) |
| U.S. allocation | ~45% (fixed target) | ~40-45% (market-cap float) |
| International developed | ~25% (fixed target) | Float with market cap |
| Emerging markets | ~5% (fixed target) | ~7% (market-cap float) |
| Distributions | Quarterly | Annual |
| Currency hedging | None | None |
| Rebalancing method | Threshold-based (~10% drift) | Market-cap weighted float |
| AUM | ~$14.8 billion | ~$12 billion |
VEQT covers approximately 4,600 more individual stocks than XEQT, largely because Vanguard’s underlying international and emerging market ETFs cast a wider net across small-cap names. When we look under the hood, the additional coverage has a negligible impact on returns — both funds are dominated by the same large-cap companies (Apple, Microsoft, Royal Bank, Shopify) that drive the majority of global equity performance.23
Both XEQT and VEQT are available commission-free on Wealthsimple with fractional shares starting at $1. Whichever you choose, the platform makes it easy to set up automatic contributions.
Why Does VEQT Allocate 30% to Canada vs XEQT’s 25%?
Vanguard set VEQT’s 30% Canadian allocation based on research showing a 25-35% home bias reduces currency volatility and maximizes the Canadian Dividend Tax Credit on eligible dividends — making it the highest home bias among all major Canadian all-equity ETFs.4 BlackRock’s XEQT sits at 25%, while BMO’s ZEQT lands at approximately 24%.
Both overweight Canada dramatically relative to the country’s ~3% share of global market capitalization. Research from Vanguard and PWL Capital suggests a 25-35% home bias is optimal for Canadian investors, primarily for two reasons.5 First, Canadian-dollar-denominated holdings reduce currency volatility across a significant portion of the portfolio. Second, Canadian equities generate eligible dividends that qualify for the Canadian Dividend Tax Credit — a meaningful tax advantage in non-registered accounts.
Ben Felix, Portfolio Manager at PWL Capital, has argued that “international diversification is crucial, both theoretically and empirically, to sensible portfolio construction” — which is precisely what both XEQT and VEQT deliver, with a deliberate Canadian overweight layered on top.6
If you’re comfortable dialing up your portfolio risk to 11 with an all-equity risk exposure, Vanguard and iShares have you covered.7
— Dan Bortolotti, Portfolio Manager at PWL Capital and creator of the Canadian Couch Potato blog, who has publicly stated that “either one of them are just fine”
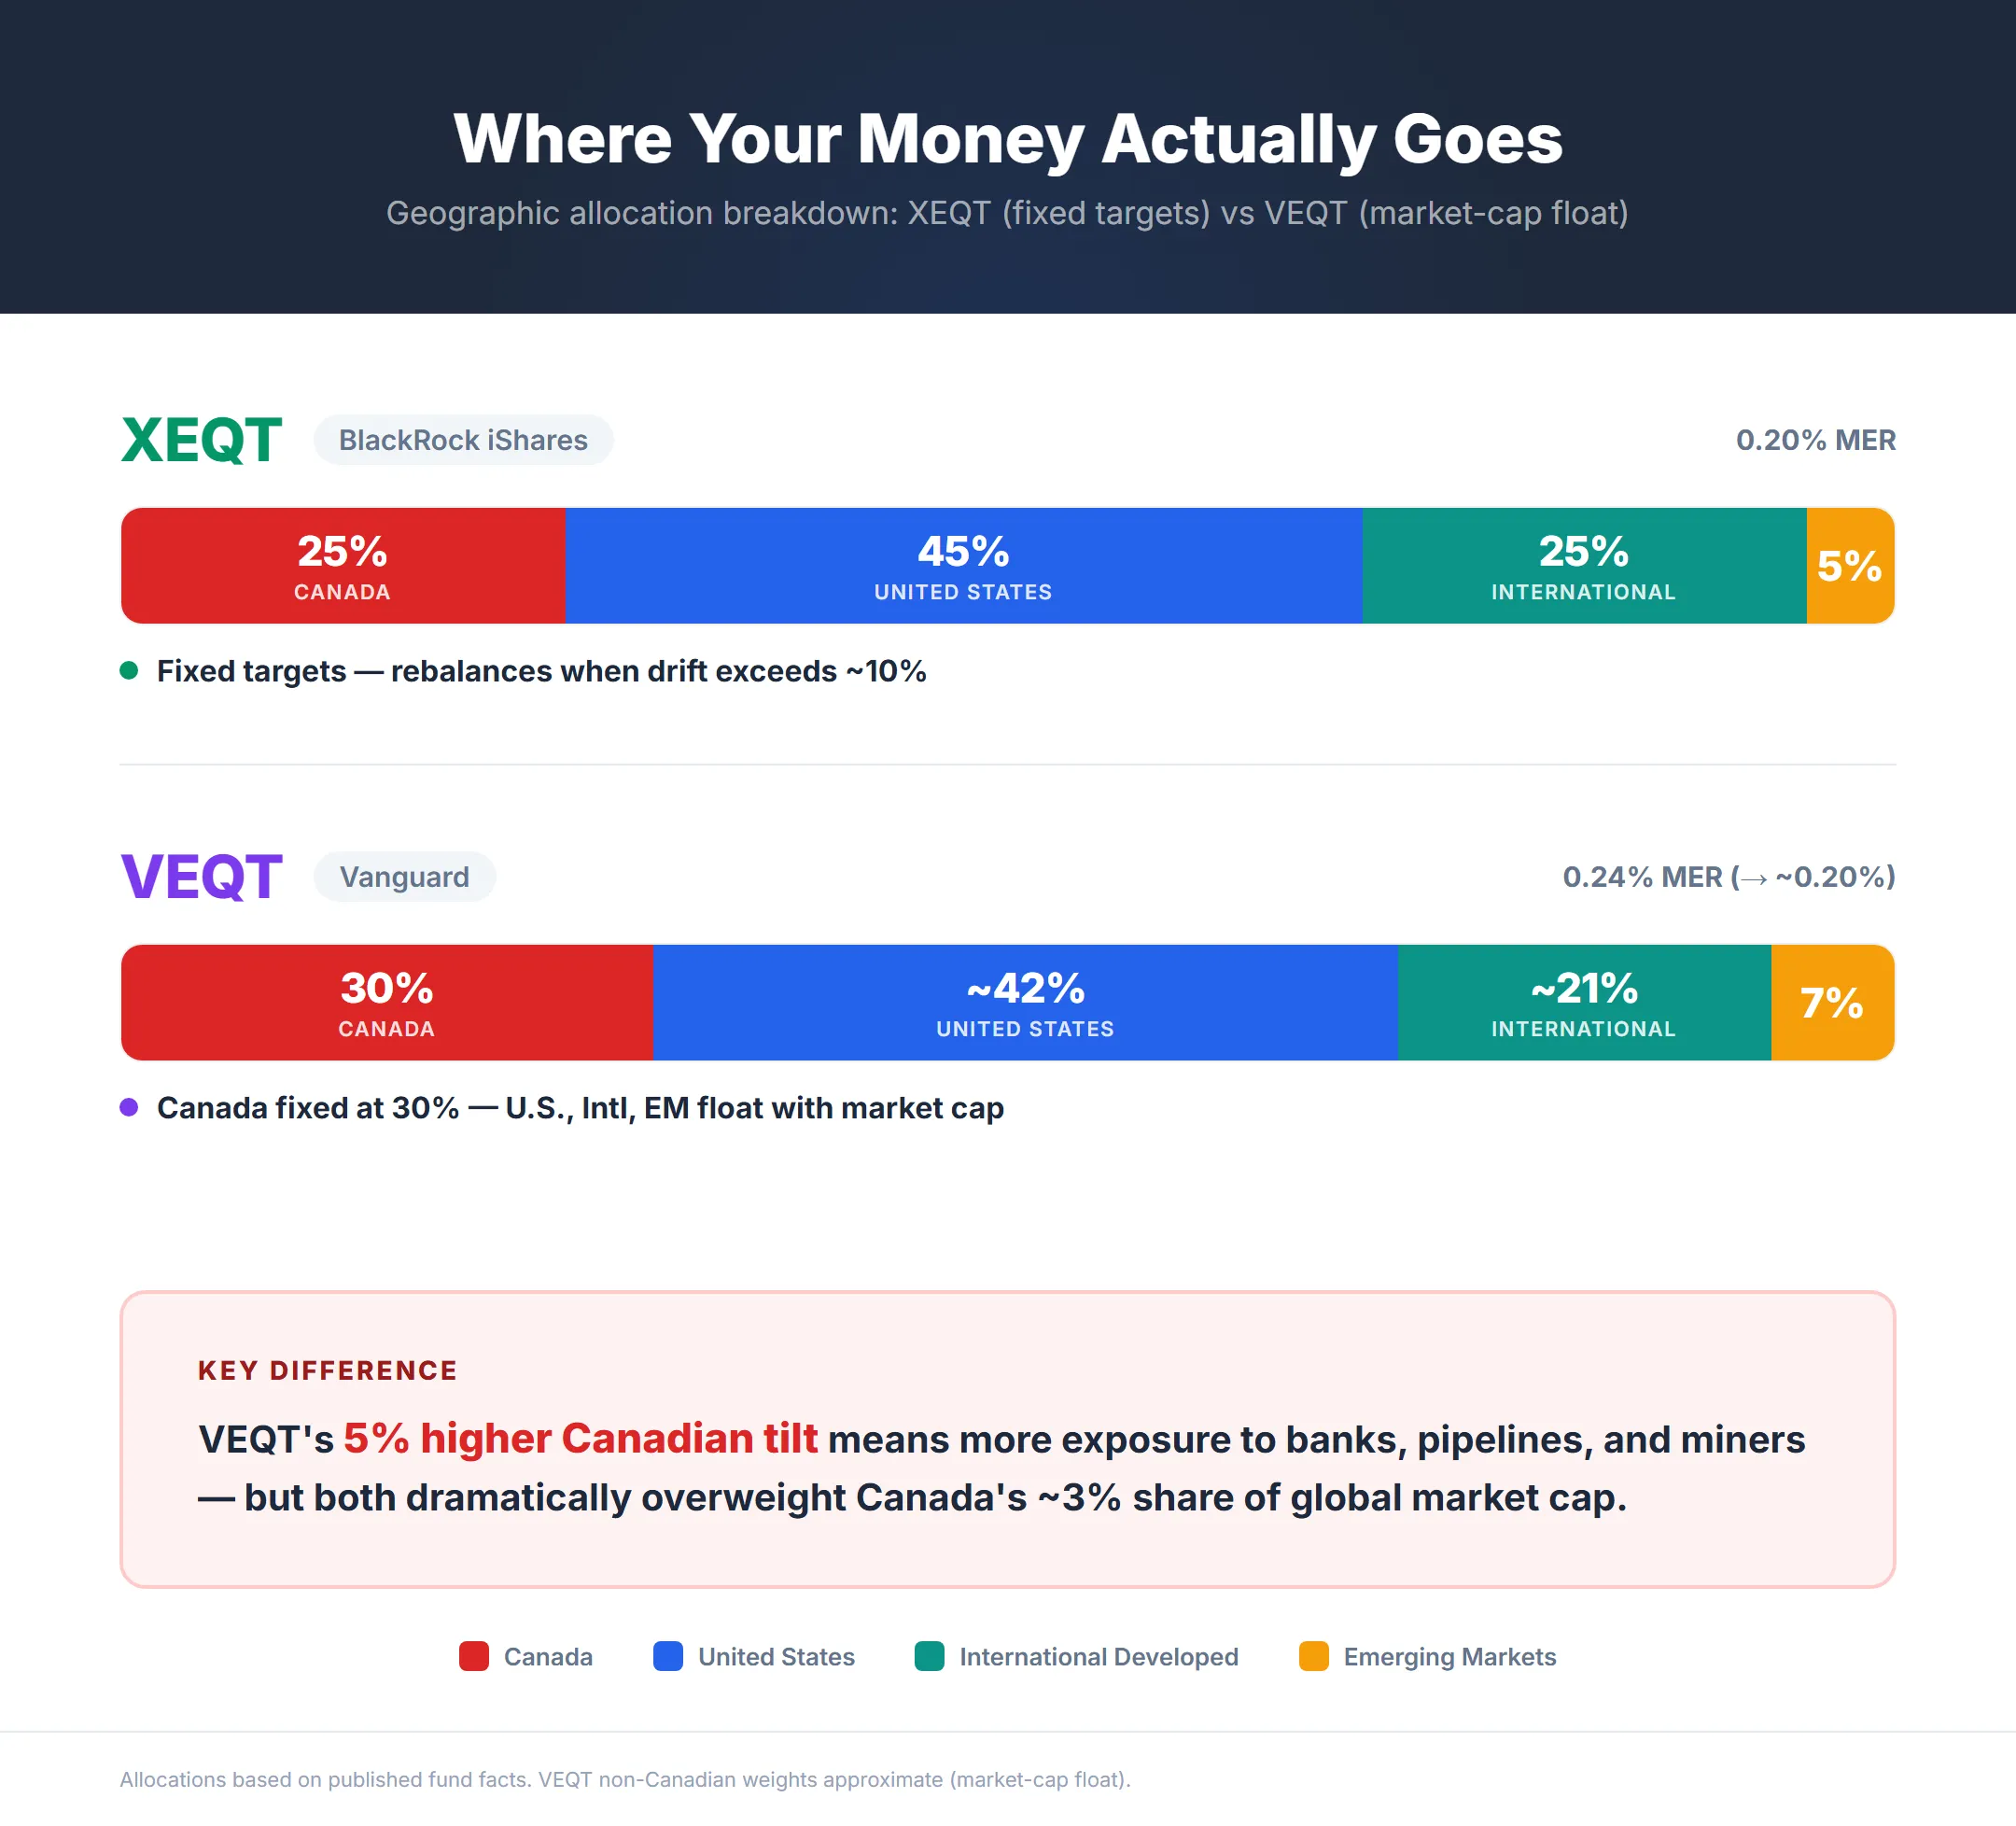
The practical difference: VEQT gives you slightly more exposure to Canadian banks, pipelines, and miners — and the TSX is heavily concentrated in just a few sectors (financials at ~31%, energy at ~12.5%). If your employment income already depends on the Canadian economy (working in resources or banking, for example), XEQT’s lower 25% home bias provides marginally better diversification against career risk.
How Does XEQT’s Fixed-Weight Strategy Differ from VEQT’s Market-Cap Float?
XEQT locks its four geographic regions to fixed targets (45% U.S., 25% Canada, 25% international, 5% emerging) and rebalances when drift exceeds 10%, while VEQT lets its non-Canadian allocations float with global market capitalization — a structural difference that produces subtly different portfolios over time.2
While VEQT fixes Canada at approximately 30%, the remaining 70% of non-Canadian assets floats with global market capitalization — meaning VEQT’s U.S. allocation rises when U.S. stocks outperform (as they did from 2020 through 2025) and falls when other regions lead.3 In practice, XEQT is a static-weight fund that rebalances back to predetermined targets; VEQT is a hybrid that lets the market determine most of its non-Canadian allocation.
For most investors, this distinction is academic — both approaches produce similar long-term outcomes. But during extended periods of U.S. outperformance, VEQT will gradually tilt more heavily toward the U.S., while XEQT mechanically trims U.S. exposure back toward 45%. If you believe in mean reversion across geographic markets, XEQT’s rebalancing discipline has a slight theoretical edge. If you believe market-cap weighting is the most efficient allocation, VEQT’s approach is more intellectually consistent.
For investors who prefer concentrated U.S. exposure over global diversification entirely, see our XEQT vs VFV comparison.
How Do XEQT and VEQT Returns Compare Since 2019?
XEQT and VEQT have delivered nearly identical returns since both funds launched in 2019, with XEQT averaging approximately 13.95% annualized since its August 2019 inception. Performance differences in any given year are typically less than 1%, driven almost entirely by the home bias gap and allocation methodology rather than fund management quality.
Annual returns since inception, side by side:23
| Year | XEQT Return | VEQT Return | Delta | What Drove the Gap |
|---|---|---|---|---|
| 2020 | 11.71% | 11.43% | -0.28% | Nearly identical — COVID recovery lifted both |
| 2021 | 19.57% | 19.66% | +0.09% | Negligible — both rode the post-pandemic rally |
| 2022 | -10.93% | -10.92% | +0.01% | Rate hikes hit both equally |
| 2023 | 17.05% | 16.95% | -0.10% | XEQT’s U.S. weight captured AI rally slightly |
| 2024 | 24.67% | 24.87% | +0.20% | VEQT’s Canadian tilt helped as TSX surged |
| 2025 | 20.45% | 20.45% | 0.00% | Identical — international rotation evened out |
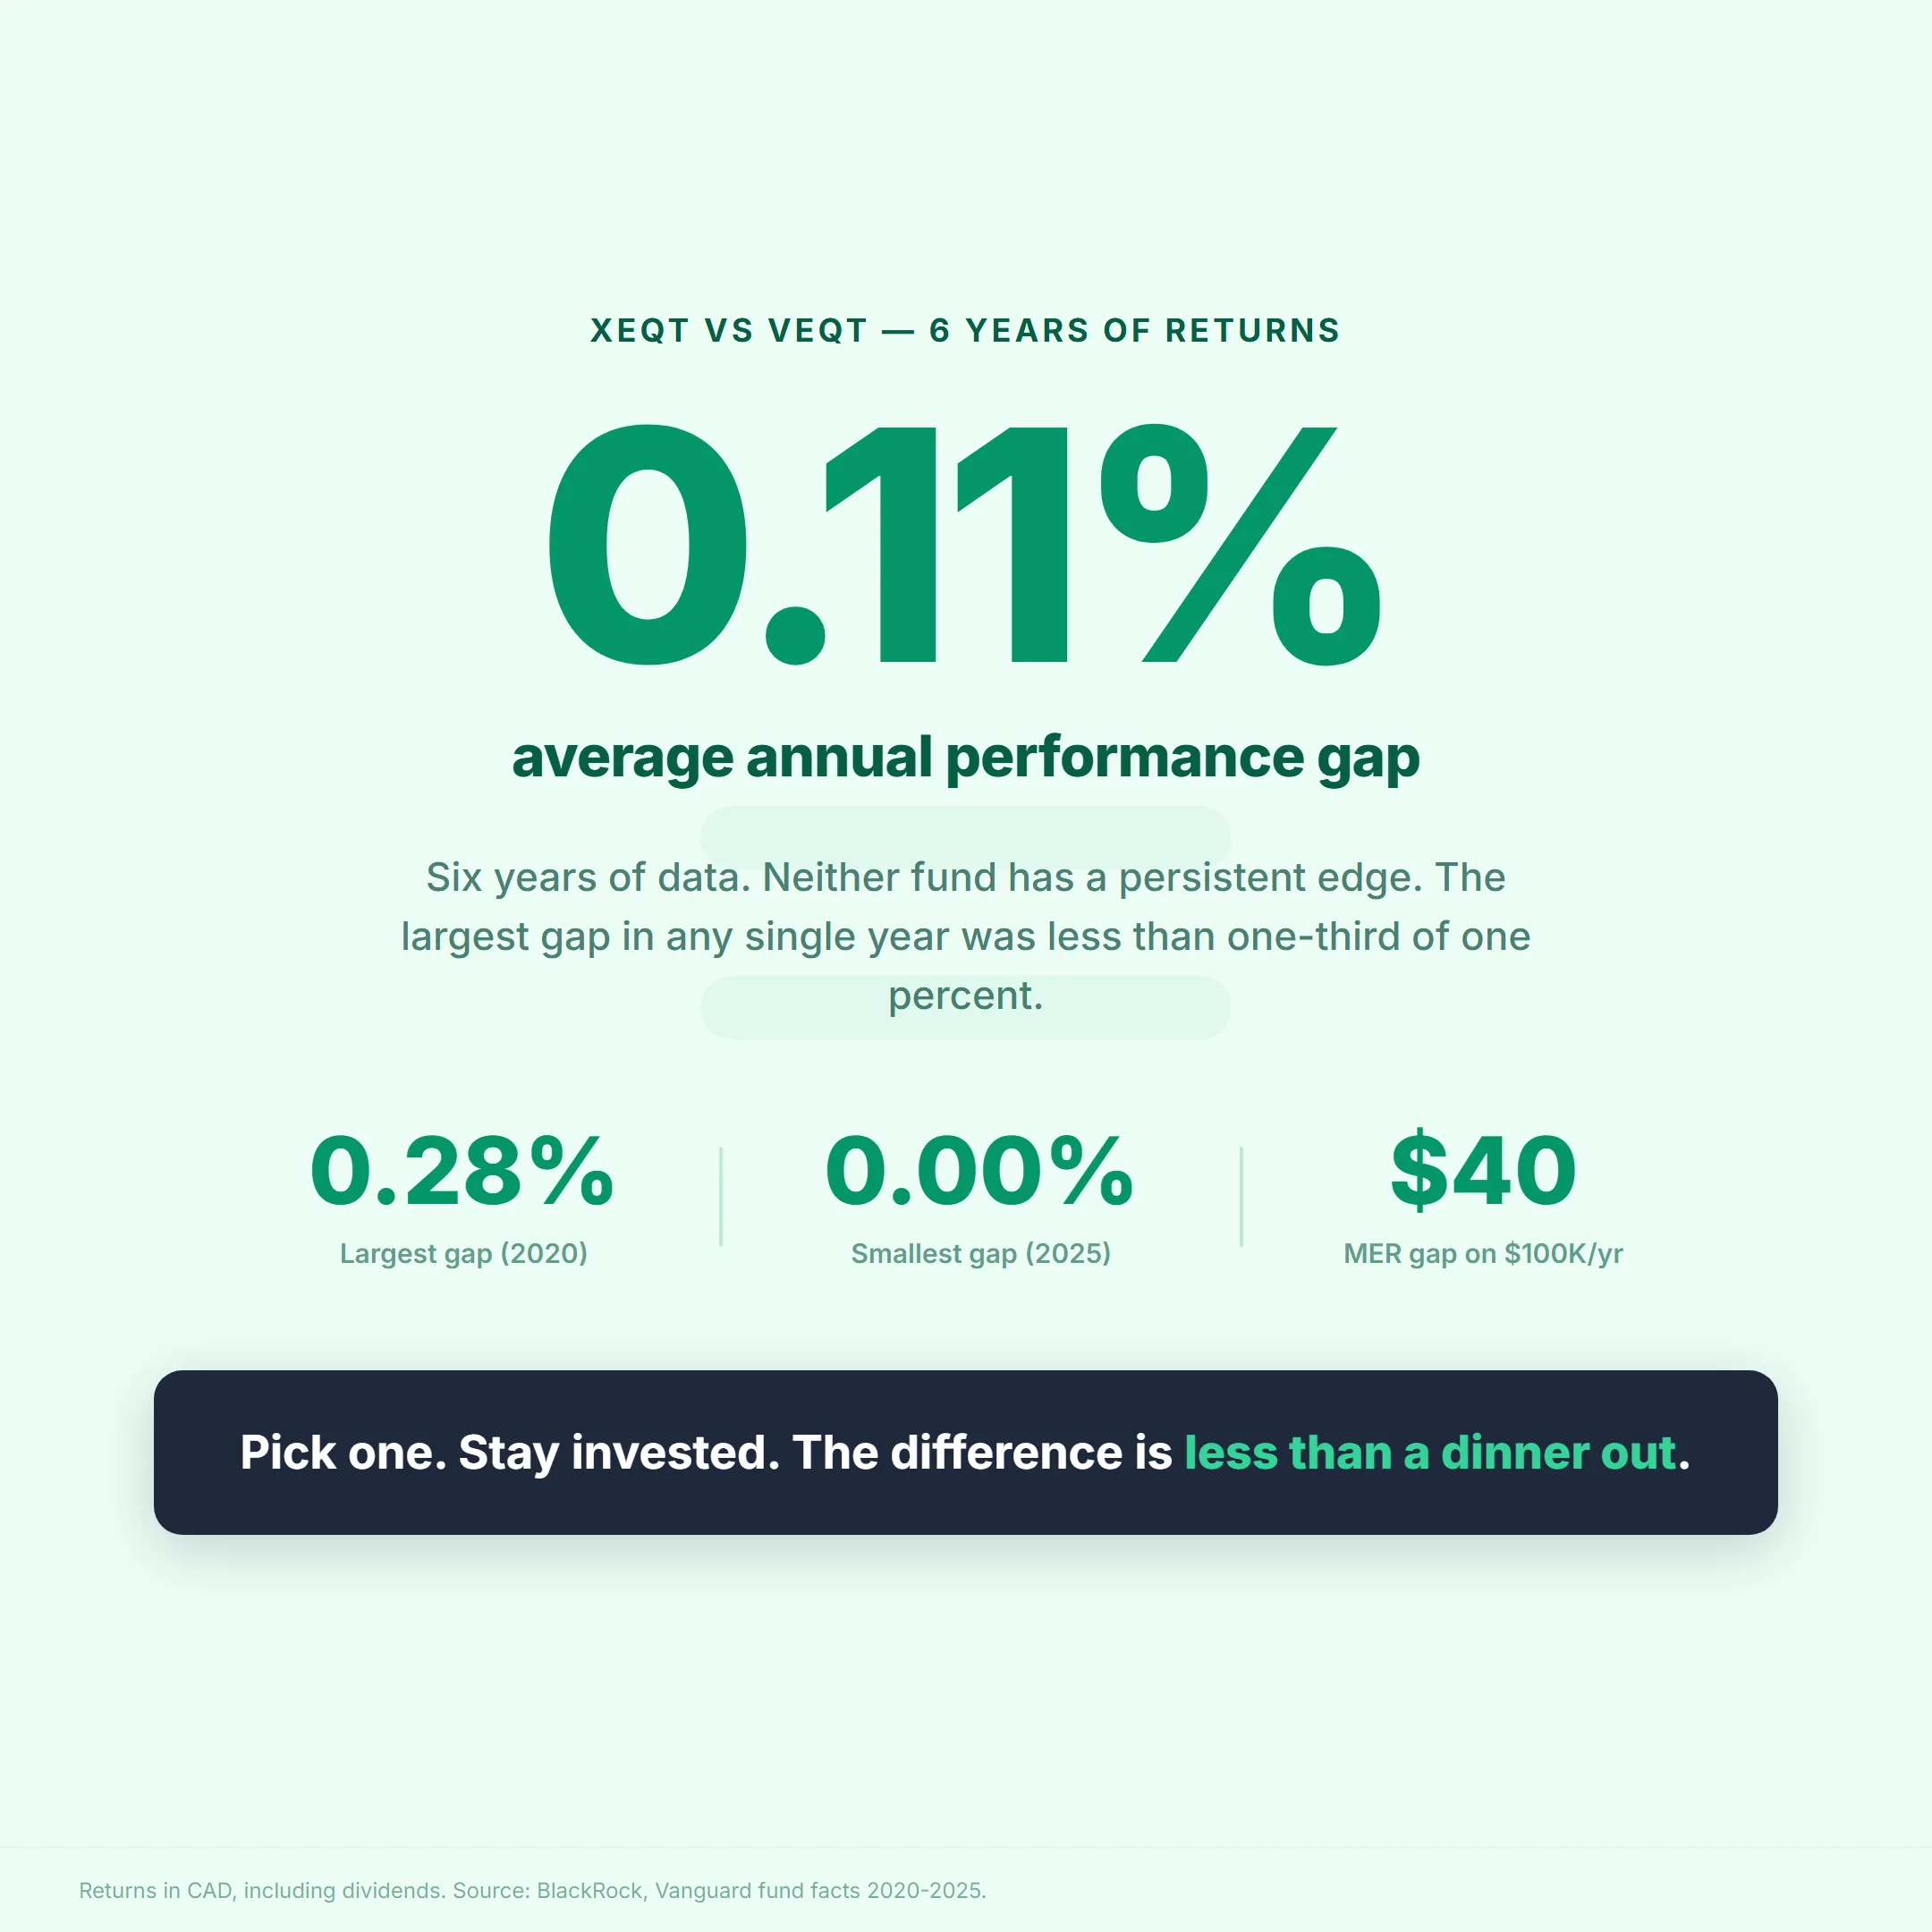
In years when Canadian equities outperform global markets, VEQT’s 30% Canadian allocation gives it a small edge. When U.S. stocks lead — as they did from 2023 through 2025 — XEQT and VEQT converge because VEQT’s U.S. allocation floats upward to follow the market.
Does the 0.04% MER Gap Between XEQT and VEQT Actually Matter?
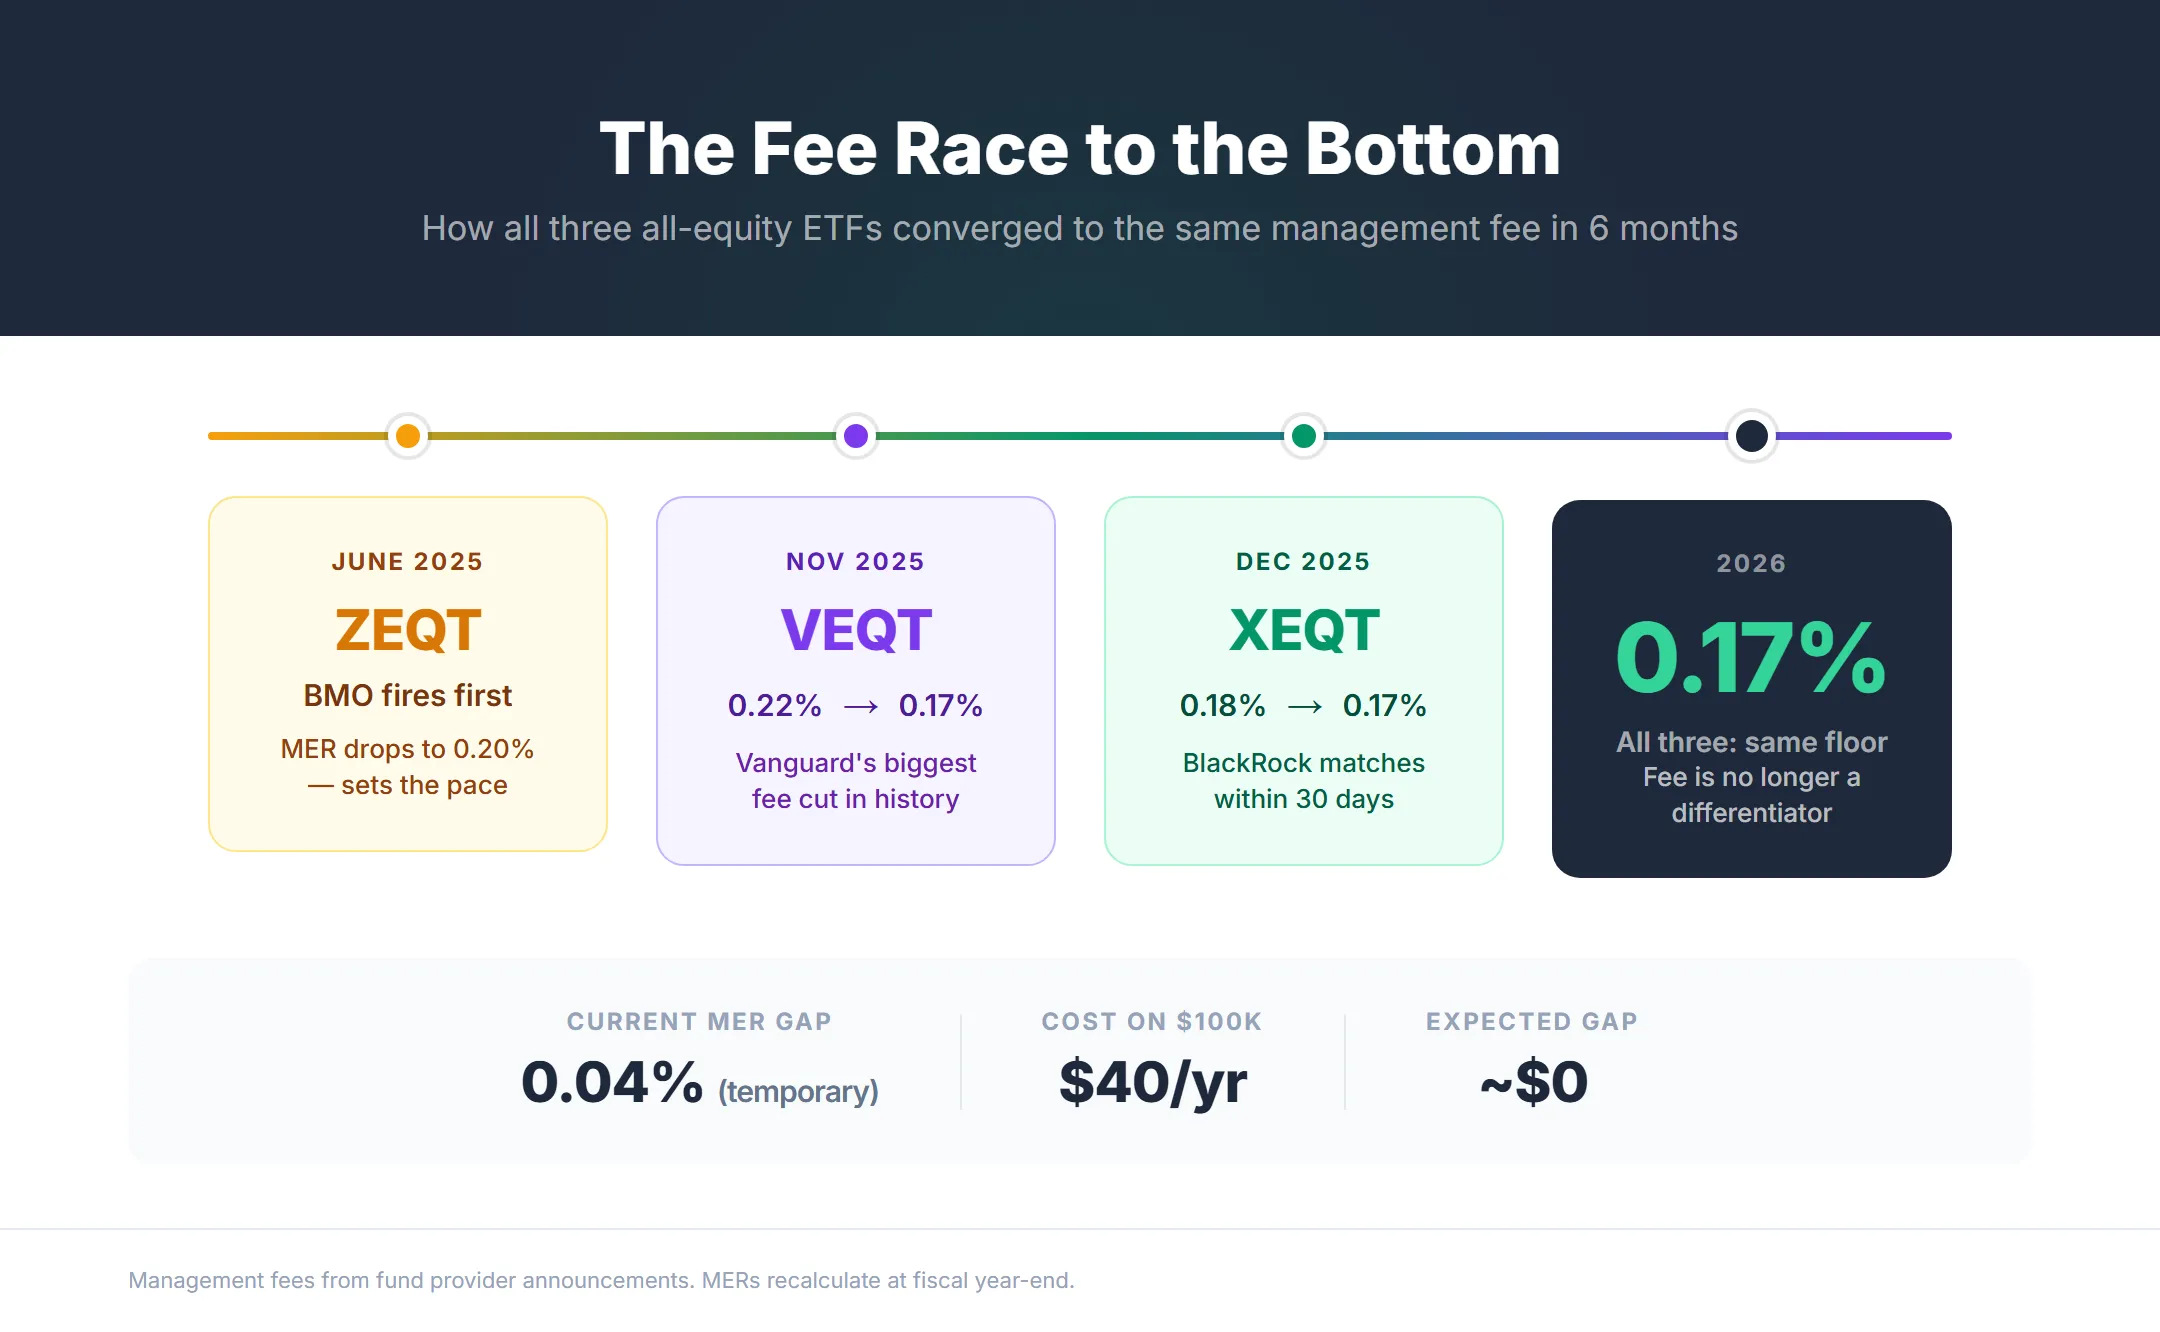
The 0.04% MER gap between XEQT and VEQT amounts to $4 per year on a $10,000 portfolio — and it’s about to disappear entirely. The published gap is based on a stale figure that hasn’t caught up to reality.
In November 2025, Vanguard cut VEQT’s management fee from 0.22% to 0.17% — the same management fee BlackRock charges for XEQT after its own December 2025 reduction.8 Canadian fund MERs only update at fiscal year-end, so VEQT’s published MER still reflects the old fee structure. Once recalculated, VEQT’s MER is expected to land in the 0.19-0.20% range — effectively matching XEQT.8
For context, the average Canadian mutual fund charges a MER above 2% — ten times either fund’s fee.1 The gap between an all-equity ETF and a traditional mutual fund dwarfs any remaining difference between XEQT and VEQT.
The bottom line: the fee gap that once favoured XEQT has effectively closed. If you already hold VEQT in a taxable account, selling triggers capital gains for zero MER benefit. If you’re starting fresh, fees are no longer a differentiator. One exception: if your position is currently at a loss, some Canadian investors use the XEQT↔VEQT swap as a tax-loss harvesting strategy — because the two funds track different underlying indices (MSCI vs FTSE), they are generally not considered “identical property” under the CRA’s superficial loss rule. That said, the CRA has not issued a formal ruling on this specific pair, so the strategy is widely practised but not explicitly blessed.
How Do XEQT’s Quarterly Dividends Compare to VEQT’s Annual Payout?
XEQT distributes dividends quarterly (end of March, June, September, and December/January), while VEQT pays a single annual distribution at year-end.23 XEQT’s trailing 12-month yield is approximately 2%; VEQT’s is similar.
The distribution frequency difference has three practical implications:
Cash flow timing. XEQT provides four smaller payouts throughout the year. VEQT delivers one larger lump sum — roughly 1.5-2% of NAV all at once in December, which causes a visible price drop on the ex-dividend date. If you see your VEQT position dip that day, it’s the cash leaving the fund, not a market correction. In our experience tracking these payouts, the actual cash distribution typically doesn’t land in your brokerage account until around January 7-8, even though it counts toward the previous tax year. For investors relying on distributions as income (though neither fund is designed for this purpose), quarterly payouts are more convenient. In our portfolio testing, we’ve found the difference to be negligible for accumulation-phase investors with DRIP enabled.
DRIP efficiency. With automatic dividend reinvestment, XEQT reinvests four times per year, putting cash back to work sooner. VEQT reinvests once. On Wealthsimple, fractional share DRIP reinvests every penny of your dividend immediately — on brokerages without fractional DRIP, you need enough shares to trigger a full-unit reinvestment, leaving cash sitting idle. For context, at current prices you’d need approximately 336 shares of XEQT (over $10,000 invested) just to generate enough quarterly yield to DRIP a single new share on a platform like Questrade. The theoretical compounding advantage of more frequent reinvestment exists but is measured in fractions of a basis point annually — mathematically real, practically invisible.
Tax reporting. In a non-registered account, XEQT generates four T3/T5 slips while VEQT generates one. The real friction isn’t the number of slips — it’s the timing. Because both funds are structured as Canadian trusts, brokerages often don’t finalize T3 slips until late February or March, which can delay early tax filing. In a Wealthsimple TFSA, Wealthsimple RRSP, or Wealthsimple FHSA, distributions are tax-sheltered and the frequency is irrelevant.
Should You Hold XEQT or VEQT in a TFSA, RRSP, or FHSA?
Both XEQT and VEQT face the same foreign withholding tax trap — the RRSP’s U.S. tax treaty exemption does not apply to either fund because both are Canadian-listed wrappers. The U.S. withholds 15% on dividends from the underlying U.S. equity component before the cash enters the Canadian fund structure.9
This means the account type decision is identical for both ETFs:
| Account | FWT Impact | Best For |
|---|---|---|
| TFSA | FWT lost permanently | Tax-free growth, most flexible |
| RRSP | FWT lost (treaty exemption doesn’t apply to wrapper) | Tax-deferred growth + contribution deduction |
| FHSA | FWT lost | Hybrid tax benefit — but 100% equity risky if buying within 10 years |
| Non-registered | FWT recoverable via foreign tax credit | Only after registered accounts are maxed |
The XEQT vs VEQT choice does not change account placement. In all registered accounts, VEQT’s higher Canadian allocation provides a slight FWT advantage (approximately 0.01-0.02% less drag) because a larger share of dividends come from Canadian companies where no foreign withholding applies. This difference is too small to influence the decision. If you haven’t yet decided which registered account to prioritize, our TFSA vs RRSP vs FHSA decision guide compares them by life stage.
For a detailed breakdown of the foreign withholding tax mechanics, including the Justin Bender Level I/Level II framework, see our XEQT ETF Review.
XEQT vs VEQT: Which Should You Buy in 2026?
In 2026, XEQT and VEQT are closer than ever — both charge a 0.17% management fee, and VEQT’s published MER (0.24%) is expected to drop to ~0.20% once recalculated. XEQT retains a slight edge on distribution frequency (quarterly vs annual) and AUM ($14.8B vs ~$12B). VEQT retains a slight edge on diversification breadth (13,000+ vs 8,400 holdings) and Canadian exposure (30% vs 25%).
None of these differences will meaningfully change your retirement outcome. Both funds automate global equity investing for less than $25 per $10,000 per year. Both are unhedged. Both face the same FWT trap. Both are available commission-free on Wealthsimple’s self-directed platform.
Our view: With fees now effectively equal, the choice comes down to distribution frequency (XEQT’s quarterly vs VEQT’s annual) and home bias preference (25% vs 30% Canadian). Neither is decisive. If you already hold one, keep it. If you hold a high-fee mutual fund and are deliberating over XEQT or VEQT, that deliberation is costing you more than the difference ever will.
You can buy either ETF on Wealthsimple with as little as $1 using fractional shares, commission-free. Use referral code 9C6DMQ to get a $25 cash bonus on your first deposit.
Frequently Asked Questions
Can you hold both XEQT and VEQT in the same portfolio?
You can, but there is no practical reason to. XEQT and VEQT overlap by approximately 90% in underlying holdings. Holding both adds complexity without meaningful diversification benefit — the marginal difference in geographic allocation is not worth managing two tickers.23
Should I switch from VEQT to XEQT to save on fees?
With both funds now charging a 0.17% management fee, there is no fee-based reason to switch. VEQT’s published MER (0.24%) still reflects the old fee structure, but once recalculated it should match XEQT’s 0.20%. In a taxable account, selling to switch triggers capital gains for effectively zero benefit.
Is ZEQT a better choice than both XEQT and VEQT?
ZEQT (BMO) charges a 0.20% MER following a June 2025 management fee reduction, matching XEQT, plus quarterly distributions and slightly higher U.S. exposure (~50% vs ~45%). It is a legitimate third option. The choice between all three comes down to provider preference — BlackRock, Vanguard, or BMO — not performance.
How do XEQT and VEQT compare to balanced ETFs like XGRO and VGRO?
XGRO (80/20 equity/bond) and VGRO are designed for investors who need built-in downside cushioning. During the 2022 correction, all-equity funds dropped approximately 11% while balanced funds fell less. If you cannot hold through a 30% drawdown without selling, a balanced ETF is the better choice regardless of the XEQT vs VEQT decision.
Does VEQT’s annual dividend payout hurt compound growth?
Not meaningfully. With DRIP enabled, annual distributions are reinvested automatically. The timing difference between quarterly and annual reinvestment amounts to fractions of a basis point annually — mathematically real but practically invisible over a 10+ year holding period.
Which has higher emerging market exposure — XEQT or VEQT?
VEQT allocates approximately 7% to emerging markets (floating with global market cap), while XEQT fixes its allocation at ~5%.23 The difference reflects VEQT’s market-cap methodology, but there’s a hidden wrinkle: their index providers classify countries differently. XEQT uses MSCI indices, which classify South Korea and Poland as emerging markets. VEQT uses FTSE indices, which place those same countries in the developed bucket.6 In years when South Korean tech rallies, XEQT’s emerging market sleeve will appear to outperform VEQT’s purely due to this classification difference — not fund management skill.
Are XEQT and VEQT both currency unhedged?
Yes. Neither XEQT nor VEQT uses currency hedging on any underlying holdings. Returns reflect both equity performance and currency movements against the Canadian dollar. Over long time horizons, currency effects tend to wash out — which is why both BlackRock and Vanguard default to unhedged structures in their all-in-one products.23
Why did both XEQT and VEQT cut management fees in late 2025?
Vanguard moved first, cutting VEQT’s management fee from 0.22% to 0.17% in November 2025 — Vanguard Canada’s biggest fee reduction in history.8 BlackRock followed a month later, reducing XEQT’s fee from 0.18% to 0.17%.2 BMO had already set the pace by cutting ZEQT’s management fee in June 2025, bringing its MER to 0.20%. All three major all-equity ETFs now share the same management fee floor. Both BlackRock and Vanguard can absorb lower fees due to scale: XEQT manages $14.8 billion, VEQT approximately $12 billion.
Does Wealthsimple offer both XEQT and VEQT?
Yes. Wealthsimple offers both XEQT and VEQT for commission-free trading with fractional shares starting at $1. You can buy either ETF in a TFSA, RRSP, FHSA, or non-registered account. Both support automatic DRIP reinvestment.
What is the tracking error difference between XEQT and VEQT?
Both XEQT and VEQT track their respective target allocations closely with minimal tracking error. VEQT runs a slightly tighter bid-ask spread (~0.028%) compared to XEQT (~0.04%), though neither is large enough to matter for buy-and-hold investors. The primary source of drift is the rebalancing methodology — XEQT uses fixed thresholds while VEQT’s non-Canadian weights float with market cap — not fund management quality.
Will VEQT’s MER drop to match XEQT’s 0.20% after the fee cut?
Most likely. Vanguard cut VEQT’s management fee from 0.22% to 0.17% in November 2025, matching XEQT’s management fee. VEQT’s published MER (0.24%) still reflects the old fee structure because MER is calculated annually in arrears. Once the next full-year MER is published, VEQT should land at approximately 0.20% — eliminating the last visible cost difference between the two funds.23
Sources
Footnotes
BlackRock — iShares Core Equity ETF Portfolio (XEQT) ↩ ↩2 ↩3 ↩4 ↩5 ↩6 ↩7 ↩8 ↩9
Vanguard Canada — VEQT Vanguard All-Equity ETF Portfolio ↩ ↩2 ↩3 ↩4 ↩5 ↩6 ↩7 ↩8
PWL Capital — All-Equity ETFs: XEQT vs VEQT (Bender, Bender & Bortolotti) ↩
Vanguard Canada — The case for global equity diversification ↩
Investment Executive — Vanguard Canada makes its biggest fee cut in history ↩ ↩2 ↩3
Canadian Portfolio Manager — Foreign Withholding Tax on International Equity ETFs (Justin Bender) ↩

About the Author
Isabelle Reuben is a specialized finance writer focused on Canadian investment platforms and bonus optimization. With 5+ years tracking robo-advisors, she stress-tests Wealthsimple's features to transform fine print into actionable blueprints.